Palm oil production has been identified as one of the major drivers of deforestation for tropical countries. To meet supply chain objectives, commodity producers and other stakeholders need timely information of land cover dynamics in their supply shed. However, such data are difficult to obtain from suppliers who may lack digital geographic representations of their supply sheds and production locations. Here we present a "community model," a machine learning model trained on pooled data sourced from many different stakeholders, to develop a specific land cover probability map, in this case a semi-global oil palm map. An advantage of this method is the inclusion of varied inputs, the ability to easily update the model as new training data becomes available and run the model on any year that input imagery is available. Inclusion of diverse data sources into one probability map can help establish a shared understanding across stakeholders on the presence and absence of a land cover or commodity (in this case oil palm). The model predictors are annual composites built from publicly available satellite imagery provided by Sentinel-1, Sentinel-2, and ALOS DSM. We provide map outputs as the probability of palm in a given pixel, to reflect the uncertainty of the underlying state (palm or not palm). The initial version of this model provides global accuracy estimated to be approximately 90 partitioned test data. This model, and resulting oil palm probability map products are useful for accurately identifying the geographic footprint of palm cultivation. Used in conjunction with timely deforestation information, this palm model is useful for understanding the risk of continued oil palm plantation expansion in sensitive forest areas.
Assessments of the status of tidal flats, one of the most extensive coastal ecosystems, have been hampered by a lack of data on their global distribution and change. Here we present globally consistent, spatially-explicit data of the occurrence of tidal flats, defined as sand, rock or mud flats that undergo regular tidal inundation. More than 1.3 million Landsat images were processed to 54 composite metrics for twelve 3-year periods, spanning four decades (1984–1986 to 2017–2019). The composite metrics were used as predictor variables in a machine-learning classification trained with more than 10,000 globally distributed training samples. We assessed accuracy of the classification with 1,348 stratified random samples across the mapped area, which indicated overall map accuracies of 82.2% (80.0–84.3%, 95% confidence interval) and 86.1% (84.2–86.8%, 95% CI) for version 1.1 and 1.2 of the data, respectively. We expect these maps will provide a means to measure and monitor a range of processes that are affecting coastal ecosystems, including the impacts of human population growth and sea level rise.
This dataset contains global maps of tidal flat ecosystems produced via a supervised classification of 707,528 Landsat Archive images. Each pixel was classified into tidal flat, permanent water or other with reference to a globally distributed set of training data. This product depicts tidal flat ecosystems around the global coastline. Pixels classified as tidal flat in the analysis represent several types of tidal flat ecosystems, including unconsolidated fine-grain sediments (tidal mudflats), unconsolidated coarse-grain sediments (tidal sand flats), and consolidated sediments, organic material or rocks (wide tidal rock-platforms), while excluding spectral signatures indicating the presence of vegetation dominated intertidal ecosystems such as mangroves and vegetated marshes. The analysis aimed to identify pixels that are subject to regular tidal inundation, and therefore may also include other intertidal systems where intertidal dynamics are observable.
Eutrophication is an emerging global issue associated with increasing anthropogenic nutrient loading. The impacts and extent of eutrophication are often limited to regions with dedicated monitoring programmes. Here we introduce the first global and Google Earth Engine-based interactive assessment tool of coastal eutrophication potential (CEP). The tool evaluates trends in satellite-derived chlorophyll- a (CHL) to devise a global map of CEP. Our analyses suggest that, globally, coastal waters (depth ≤200 m) covering ∼1.15 million km 2 are eutrophic potential. Also, waters associated with CHL increasing trends—eutrophication potential—are twofold higher than those showing signs of recovery. The tool effectively identified areas of known eutrophication with severe symptoms, like dead zones, as well as those with limited to no information of the eutrophication. Our tool introduces the prospect for a consistent global assessment of eutrophication trends with major implications for monitoring Sustainable Development Goals (SDGs) and the application of Earth Observations in support of SDGs.
Increasing human populations around the global coastline have caused extensive loss, degradation and fragmentation of coastal ecosystems, threatening the delivery of important ecosystem services 1 . As a result, alarming losses of mangrove, coral reef, seagrass, kelp forest and coastal marsh ecosystems have occurred 1 – 6 . However, owing to the difficulty of mapping intertidal areas globally, the distribution and status of tidal flats—one of the most extensive coastal ecosystems—remain unknown 7 . Here we present an analysis of over 700,000 satellite images that maps the global extent of and change in tidal flats over the course of 33 years (1984–2016). We find that tidal flats, defined as sand, rock or mud flats that undergo regular tidal inundation 7 , occupy at least 127,921 km 2 (124,286–131,821 km 2 , 95% confidence interval). About 70% of the global extent of tidal flats is found in three continents (Asia (44% of total), North America (15.5% of total) and South America (11% of total)), with 49.2% being concentrated in just eight countries (Indonesia, China, Australia, the United States, Canada, India, Brazil and Myanmar). For regions with sufficient data to develop a consistent multi-decadal time series—which included East Asia, the Middle East and North America—we estimate that 16.02% (15.62–16.47%, 95% confidence interval) of tidal flats were lost between 1984 and 2016. Extensive degradation from coastal development 1 , reduced sediment delivery from major rivers 8 , 9 , sinking of riverine deltas 8 , 10 , increased coastal erosion and sea-level rise 11 signal a continuing negative trajectory for tidal flat ecosystems around the world. Our high-spatial-resolution dataset delivers global maps of tidal flats, which substantially advances our understanding of the distribution, trajectory and status of these poorly known coastal ecosystems.
 Nicholas Etienne Clinton合作论文数Google5
 Renee Johnston合作论文数4
 Richard Fuller合作论文数School of the Environment, Faculty of Science, The University of Queensland4
 Nicholas Murray合作论文数James Cook University4
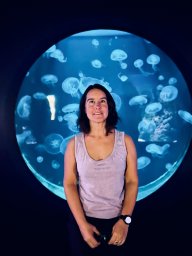 Ferrari Renata合作论文数School of Biological Sciences, University of Sydney;School of Engineering, University of Sydney;University of Sydney, University of Sydney4
 Stuart Phinn合作论文数School of the Environment, Faculty of Science, The University of Queensland4
 Mitchell Lyons合作论文数The University of New South Wales3Aaron Yonas合作论文数1
 oliver guinan合作论文数1
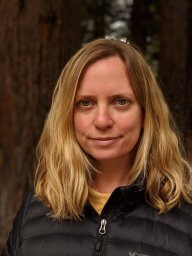 Tanya Birch合作论文数Google LLC1
 Quyen Nguyen合作论文数Corresponding author.1
 Eligio Maure合作论文数1
 Andreas Vollrath合作论文数European Space Agency, ESRIN, Via Galileo Galilei, Casella Postale 64, 00044 Frascati (RM), Italy1
 Genki Terauchi合作论文数Northwest Pacific Reg Environm Cooperat Ctr, Toyama, Toyama 9300856, Japan1Rémi D'Annunzio合作论文数1
 Karis Tenneson合作论文数Spatial Informat Grp Nat Assets Lab, Pleasanton, CA 94566 USA1
 Daniel Silveira Coelho合作论文数Universidade de Aveiro1Poortinga Ate合作论文数Soil Physics and Land Management, Wageningen University1
 Saah David合作论文数Spatial Informat Grp LLC1
 Joji Ishizaka (石坂丞二)合作论文数Institute for Space-Earth Environmental Research, Nagoya University1
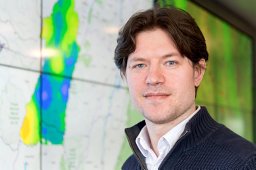 G. Donchyts合作论文数Deltares1
 Fred Stolle合作论文数Jade Realty Inc1David Thau合作论文数Department of Computer Science, University of California, Davis1Aashish Gadani合作论文数1




