We use Spitzer/IRAC deep exposure data covering two significantly larger than before sky areas to construct maps suitable for evaluating source-subtracted fluctuations in the cosmic infrared background (CIB). The maps are constructed using the self-calibration methodology eliminating artifacts to sufficient accuracy and subset maps are selected in each area containing approximately uniform exposures. These maps are clipped and removed of known sources and then Fourier transformed to probe the CIB anisotropies to new larger scales. The power spectrum of the resultant CIB anisotropies is measured from the data to >1 degree revealing the component well above that from remaining known galaxies on scales >1 arcmin. The fluctuations are demonstrated to be free of Galactic and Solar System foreground contributions out to the largest scales measured. We discuss the proposed theories for the origin of the excess CIB anisotropies in light of the new data. Out of these, the model where the CIB fluctuation excess originates from the granulation power due to LIGO-observed primordial black holes as dark matter appears most successful in accounting for all observations related to the measured CIB power amplitude and spatial structure, including the measured coherence between the CIB and unresolved cosmic X-ray background (CXB). Finally we point out the use of the data to probe the CIB-CXB cross-power to new scales and higher accuracy. We also discuss the synergy of these data with future CIB programs at shorter near-IR wavelengths with deep wide surveys and sub-arcsecond angular resolution as provided by Euclid and Roman space missions.
New determinations are presented of the cosmic infrared background monopole brightness in the Planck HFI bands from 100 GHz to 857 GHz. Planck was not designed to measure the monopole component of sky brightness, so cross-correlation of the 2015 HFI maps with COBE/FIRAS data is used to recalibrate the zero level of the HFI maps. For the HFI 545 and 857 GHz maps, the brightness scale is also recalibrated. Correlation of the recalibrated HFI maps with a linear combination of Galactic H I and H alpha data is used to separate the Galactic foreground emission and determine the cosmic infrared background brightness in each of the HFI bands. We obtain CIB values of 0.007 +- 0.014, 0.010 +- 0.019, 0.060 +- 0.023, 0.149 +- 0.017, 0.371 +- 0.018, and 0.576 +- 0.034 MJy/sr at 100, 143, 217, 353, 545, and 857 GHz, respectively. The estimated uncertainties for the 353 to 857 GHz bands are about 3 to 6 times smaller than those of previous direct CIB determinations at these frequencies. Our results are compared with integrated source brightness results from selected recent submillimeter and millimeter wavelength imaging surveys.
While the upcoming telescopes will reveal correspondingly fainter, more distant galaxies, a question will persist: what more is there that these telescopes cannot see? One answer is the source-subtracted Cosmic Infrared Background (CIB). The CIB is comprised of the collective light from all sources remaining after known, resolved sources are accounted for. Ever-more-sensitive surveys will identify the brightest of these, allowing them to be removed, and - like peeling layers off an onion - reveal deeper layers of the CIB. In this way it is possible to measure the contributions from populations not accessible to direct telescopic observation. Measurement of fluctuations in the source-subtracted CIB, i.e., the spatial power spectrum of the CIB after subtracting resolved sources, provides a robust means of characterizing its faint, and potentially new, populations. Studies over the past 15 years have revealed source-subtracted CIB fluctuations on scales out to ~100' which cannot be explained by extrapolating from known galaxy populations. Moreover, they appear highly coherent with the unresolved Cosmic X-ray Background, hinting at a significant population of accreting black holes among the CIB sources. Characterizing the source-subtracted CIB with high accuracy, and thereby constraining the nature of the new populations, is feasible with upcoming instruments and would produce critically important cosmological information in the next decade. New coextensive deep and wide-area near-infrared, X-ray, and microwave surveys will bring decisive opportunities to examine, with high fidelity, the spatial spectrum and origin of the CIB fluctuations and their cross-correlations with cosmic microwave and X-ray backgrounds, and determine the formation epochs and the nature of the new sources (stellar nucleosynthetic or accreting black holes).
Accurate modeling of the spectrum of thermal dust emission at millimeter wavelengths is important for improving the accuracy of foreground subtraction for CMB measurements, for improving the accuracy with which the contributions of different foreground emission components can be determined, and for improving our understanding of dust composition and dust physics. We fit four models of dust emission to high Galactic latitude COBE/FIRAS and COBE/DIRBE observations from 3 millimeters to 100 microns and compare the quality of the fits. We consider the two-level systems model because it provides a physically motivated explanation for the observed long wavelength flattening of the dust spectrum and the anticorrelation between emissivity index and dust temperature. We consider the model of Finkbeiner, Davis, and Schlegel because it has been widely used for CMB studies, and the generalized version of this model recently applied to Planck data by Meisner and Finkbeiner. For comparison we have also fit a phenomenological model consisting of the sum of two graybody components. We find that the two-graybody model gives the best fit and the FDS model gives a significantly poorer fit than the other models. The Meisner and Finkbeiner model and the two-level systems model remain viable for use in Galactic foreground subtraction, but the FIRAS data do not have sufficient signal-to-noise ratio to provide a strong test of the predicted spectrum at millimeter wavelengths.
(Abridged) The 7-year WMAP data and improved astrophysical data rigorously test the standard cosmological model and its extensions. By combining WMAP with the latest distance measurements from BAO and H0 measurement, we determine the parameters of the simplest LCDM model. The power-law index of the primordial power spectrum is n_s=0.968+-0.012, a measurement that excludes the scale-invariant spectrum by 99.5%CL. The other parameters are also improved from the 5-year results. Notable examples of improved parameters are the total mass of neutrinos, sum(m_nu)<0.58eV, and the effective number of neutrino species, N_eff=4.34+0.86-0.88. We detect the effect of primordial helium on the temperature power spectrum and provide a new test of big bang nucleosynthesis. We detect, and show on the map for the first time, the tangential and radial polarization patterns around hot and cold spots of temperature fluctuations, an important test of physical processes at z=1090 and the dominance of adiabatic scalar fluctuations. With the 7-year TB power spectrum, the limit on a rotation of the polarization plane due to potential parity-violating effects has improved to Delta(alpha)=-1.1+-1.4(stat)+-1.5(syst) degrees. We report significant detections of the SZ effect at the locations of known clusters of galaxies. The measured SZ signal agrees well with the expected signal from the X-ray data. However, it is a factor of 0.5 to 0.7 times the predictions from "universal profile" of Arnaud et al., analytical models, and hydrodynamical simulations. We find, for the first time in the SZ effect, a significant difference between the cooling-flow and non-cooling-flow clusters (or relaxed and non-relaxed clusters), which can explain some of the discrepancy. This lower amplitude is consistent with the lower-than-theoretically-expected SZ power spectrum recently measured by the South Pole Telescope collaboration.
We present WMAP seven-year observations of bright sources which are often used as calibrators at microwave frequencies. Ten objects are studied in five frequency bands (23–94 GHz): the outer planets (Mars, Jupiter, Saturn, Uranus, and Neptune) and five fixed celestial sources (Cas A, Tau A, Cyg A, 3C274, and 3C58). The seven-year analysis of Jupiter provides temperatures which are within 1σ of the previously published WMAP five-year values, with slightly tighter constraints on variability with orbital phase (0.2% ± 0.4%), and limits (but no detections) on linear polarization. Observed temperatures for both Mars and Saturn vary significantly with viewing geometry. Scaling factors are provided which, when multiplied by the Wright Mars thermal model predictions at 350 μm, reproduce WMAP seasonally averaged observations of Mars within ∼2%. An empirical model is described which fits brightness variations of Saturn due to geometrical effects and can be used to predict the WMAP observations to within 3%. Seven-year mean temperatures for Uranus and Neptune are also tabulated. Uncertainties in Uranus temperatures are 3%–4% in the 41, 61, and 94 GHz bands; the smallest uncertainty for Neptune is 8% for the 94 GHz band. Intriguingly, the spectrum of Uranus appears to show a dip at ∼30 GHz of unidentified origin, although the feature is not of high statistical significance. Flux densities for the five selected fixed celestial sources are derived from the seven-year WMAP sky maps and are tabulated for Stokes I, Q, and U, along with polarization fraction and position angle. Fractional uncertainties for the Stokes I fluxes are typically 1% to 3%. Source variability over the seven-year baseline is also estimated. Significant secular decrease is seen for Cas A and Tau A: our results are consistent with a frequency-independent decrease of about 0.53% per year for Cas A and 0.22% per year for Tau A. We present WMAP polarization data with uncertainties of a few percent for Tau A. Where appropriate, WMAP results are compared against previous findings in the literature. With an absolute calibration uncertainty of 0.2%, WMAP data are a valuable asset for calibration work.
(Abridged) A simple six-parameter LCDM model provides a successful fit to WMAP data, both when the data are analyzed alone and in combination with other cosmological data. Even so, it is appropriate to search for any hints of deviations from the now standard model of cosmology, which includes inflation, dark energy, dark matter, baryons, and neutrinos. The cosmological community has subjected the WMAP data to extensive and varied analyses. While there is widespread agreement as to the overall success of the six-parameter LCDM model, various "anomalies" have been reported relative to that model. In this paper we examine potential anomalies and present analyses and assessments of their significance. In most cases we find that claimed anomalies depend on posterior selection of some aspect or subset of the data. Compared with sky simulations based on the best fit model, one can select for low probability features of the WMAP data. Low probability features are expected, but it is not usually straightforward to determine whether any particular low probability feature is the result of the a posteriori selection or of non-standard cosmology. We examine in detail the properties of the power spectrum with respect to the LCDM model. We examine several potential or previously claimed anomalies in the sky maps and power spectra, including cold spots, low quadrupole power, quadropole-octupole alignment, hemispherical or dipole power asymmetry, and quadrupole power asymmetry. We conclude that there is no compelling evidence for deviations from the LCDM model, which is generally an acceptable statistical fit to WMAP and other cosmological data.
The WMAP mission has produced sky maps from seven years of observations at L2. We present the angular power spectra derived from the seven-year maps and discuss the cosmological conclusions that can be inferred from WMAP data alone. With the seven-year data, the temperature (TT) spectrum measurement has a signal-to-noise ratio per multipole that exceeds unity for l < 919; and in band powers of width Δl = 10, the signal-to-noise ratio exceeds unity up to l = 1060. The third acoustic peak in the TT spectrum is now well measured by WMAP. In the context of a flat ΛCDM model, this improvement allows us to place tighter constraints on the matter density from WMAP data alone, Ωmh2 = 0.1334+0.0056−0.0055, and on the epoch of matter-radiation equality, zeq = 3196+134−133. The temperature-polarization (TE) spectrum is detected in the seven-year data with a significance of 20σ, compared to 13σ with the five-year data. We now detect the second dip in the TE spectrum near l ∼ 450 with high confidence. The TB and EB spectra remain consistent with zero, thus demonstrating low systematic errors and foreground residuals in the data. The low-l EE spectrum, a measure of the optical depth due to reionization, is detected at 5.5σ significance when averaged over l = 2–7: l(l + 1)CEEl/(2π) = 0.074+0.034−0.025 μK2 (68% CL). We now detect the high-l, 24 ⩽ l ⩽ 800, EE spectrum at over 8σ. The BB spectrum, an important probe of gravitational waves from inflation, remains consistent with zero; when averaged over l = 2–7, l(l + 1)CBBl/(2π) < 0.055 μK2 (95% CL). The upper limit on tensor modes from polarization data alone is a factor of two lower with the seven-year data than it was using the five-year data. The data remain consistent with the simple ΛCDM model: the best-fit TT spectrum has an effective χ2 of 1227 for 1170 degrees of freedom, with a probability to exceed of 9.6%. The allowable volume in the six-dimensional space of ΛCDM parameters has been reduced by a factor of 1.5 relative to the five-year volume, while the ΛCDM model that allows for tensor modes and a running scalar spectral index has a factor of three lower volume when fit to the seven-year data. We test the parameter recovery process for bias and find that the scalar spectral index, ns, is biased high, but only by 0.09σ, while the remaining parameters are biased by <0.15σ. The improvement in the third peak measurement leads to tighter lower limits from WMAP on the number of relativistic degrees of freedom (e.g., neutrinos) in the early universe: Neff>2.7(95%CL). Also, using WMAP data alone, the primordial helium mass fraction is found to be YHe = 0.28+0.14−0.15, and with data from higher-resolution cosmic microwave background experiments included, we now establish the existence of pre-stellar helium at >3σ. These new WMAP measurements provide important tests of big bang cosmology.
New full-sky temperature and polarization maps based on seven years of data from WMAP are presented. The new results are consistent with previous results, but have improved due to reduced noise from the additional integration time, improved knowledge of the instrument performance, and improved data analysis procedures. The improvements are described in detail. The seven-year data set is well fit by a minimal six-parameter flat Lambda CDM model. The parameters for this model, using the WMAP data in conjunction with baryon acoustic oscillation data from the Sloan Digital Sky Survey and priors on H-0 from Hubble Space Telescope observations, are Omega(b)h(2) = 0.02260 +/- 0.00053, Omega(c)h(2) = 0.1123 +/- 0.0035, Omega(Lambda) = 0.728(-0.016)(+0.015), n(s) = 0.963 +/- 0.012, tau = 0.087 +/- 0.014, and sigma(8) = 0.809 +/- 0.024 (68% CL uncertainties). The temperature power spectrum signal-to-noise ratio per multipole is greater that unity for multipoles l less than or similar to 919, allowing a robust measurement of the third acoustic peak. This measurement results in improved constraints on the matter density, Omega(m)h(2) = 0.1334(-0.0055)(+0.0056), and the epoch of matter-radiation equality, z(eq) = 3196(-133)(+134), using WMAP data alone. The new WMAP data, when combined with smaller angular scale microwave background anisotropy data, result in a 3 sigma detection of the abundance of primordial helium, Y-He = 0.326 +/- 0.075. When combined with additional external data sets, the WMAP data also yield better determinations of the total mass of neutrinos, Sigma m(nu) <= 0.58 eV (95% CL), and the effective number of neutrino species, N-eff = 4.34(-0.88)(+0.86). The power-law index of the primordial power spectrum is now determined to be n(s) = 0.963 +/- 0.012, excluding the Harrison-Zel'dovich-Peebles spectrum by >3 sigma. These new WMAP measurements provide important tests of big bang cosmology.
We describe a sampling method to estimate the polarized cosmic microwave background (CMB) signal from observed maps of the sky. We use a Metropolis-within-Gibbs algorithm to estimate the polarized CMB map, containing Q and U Stokes parameters at each pixel, and its covariance matrix. These can be used as inputs for cosmological analyses. The polarized sky signal is parameterized as the sum of three components: CMB, synchrotron emission, and thermal dust emission. The polarized Galactic components are modeled with spatially varying power-law spectral indices for the synchrotron, and a fixed power law for the dust, and their component maps are estimated as by-products. We apply the method to simulated low-resolution maps with pixels of side 7.2 deg, using diagonal and full noise realizations drawn from the WMAP noise matrices. The CMB maps are recovered with goodness of fit consistent with errors. Computing the likelihood of the E-mode power in the maps as a function of optical depth to reionization, tau, for fixed temperature anisotropy power, we recover tau = 0.091 +/- 0.019 for a simulation with input tau = 0.1, and mean tau = 0.098 averaged over 10 simulations. A "null" simulation with no polarized CMB signal has maximum likelihood consistent with tau = 0. The method is applied to the five-year WMAP data, using the K, Ka, Q, and V channels. We find tau = 0.090 +/- 0.019, compared to tau = 0.086 +/- 0.016 from the template-cleaned maps used in the primary WMAP analysis. The synchrotron spectral index, beta, averaged over high signal-to-noise pixels with standard deviation sigma(beta) < 0.25, but excluding similar to 6% of the sky masked in the Galactic plane, is - 3.03 +/- 0.04. This estimate does not vary significantly with Galactic latitude, although includes an informative prior.
Cosmology and other scientific results from the Wilkinson Microwave Anisotropy Probe (WMAP) mission require an accurate knowledge of the beam patterns in flight. While the degree of beam knowledge for the WMAP one-year and three-year results was unprecedented for a CMB experiment, we have significantly improved the beam determination as part of the five-year data release. Physical optics fits are done on both the A and the B sides for the first time. The cutoff scale of the fitted distortions on the primary mirror is reduced by a factor of ∼2 from previous analyses. These changes enable an improvement in the hybridization of Jupiter data with beam models, which is optimized with respect to error in the main beam solid angle. An increase in main-beam solid angle of ∼1% is found for the V2 and W1–W4 differencing assemblies. Although the five-year results are statistically consistent with previous ones, the errors in the five-year beam transfer functions are reduced by a factor of ∼2 as compared to the three-year analysis. We present radiometry of the planet Jupiter as a test of the beam consistency and as a calibration standard; for an individual differencing assembly, errors in the measured disk temperature are ∼0.5%.
We present the list of point sources found in the Wilkinson Microwave Anisotropy Probe (WMAP) five-year maps. The technique used in the first-year and three-year analyses now finds 390 point sources, and the five-year source catalog is complete for regions of the sky away from the Galactic plane to a 2 Jy limit, with SNR >4.7 in all bands in the least covered parts of the sky. The noise at high frequencies is still mainly radiometer noise, but at low frequencies the cosmic microwave background (CMB) anisotropy is the largest uncertainty. A separate search of CMB-free V–W maps finds 99 sources of which all but one can be identified with known radio sources. The sources seen by WMAP are not strongly polarized. Many of the WMAP sources show significant variability from year to year, with more than a 2:1 range between the minimum and maximum fluxes.
We present the temperature and polarization angular power spectra of the cosmic microwave background derived from the first five years of Wilkinson Microwave Anisotropy Probe data. The five-year temperature spectrum is cosmic variance limited up to multipole ℓ = 530, and individual ℓ-modes have signal-to-noise ratio S/N >1 for ℓ < 920. The best-fitting six-parameter ΛCDM model has a reduced χ2 for ℓ = 33–1000 of χ2/ν = 1.06, with a probability to exceed of 9.3%. There is now significantly improved data near the third peak which leads to improved cosmological constraints. The temperature-polarization correlation is seen with high significance. After accounting for foreground emission, the low-ℓ reionization feature in the EE power spectrum is preferred by Δχ2 = 19.6 for optical depth τ = 0.089 by the EE data alone, and is now largely cosmic variance limited for ℓ = 2–6. There is no evidence for cosmic signal in the BB, TB, or EB spectra after accounting for foreground emission. We find that, when averaged over ℓ = 2–6, ℓ(ℓ + 1)CBBℓ/(2π) < 0.15 μK2 (95% CL).
 J. L. Weiland合作论文数35
 Edward J Wollack合作论文数Goddard Space Flight Center, National Aeronautics and Space Administration28
 David Spergel合作论文数Center for Computational Astrophysics, Flatiron Institute;Department of Astrophysical Sciences, Princeton University,26
 Alan J. Kogut合作论文数Goddard Space Flight Center, National Aeronautics and Space Administration23L. Page合作论文数21G. S. Tucker合作论文数21
 Gary Hinshaw合作论文数Department of Physics & Astronomy, The University of British Columbia21
 Norman Jarosik合作论文数Department of Physics, Princeton University21
 Eiichiro Komatsu合作论文数Department of Physical Cosmology, Max Planck Institute for Astrophysics;The International Max Planck Research School on Astrophysics, Ludwig Maximilians University Munich21M. R. Nolta合作论文数21
 Michele Limon合作论文数Goddard Space Flight Center21
 Stephan S. Meyer合作论文数Department of Astronomy and Astrophysics, University of Chicago;Enrico Fermi Institute, University of Chicago;Kavli Institute for Cosmological Physics, University of Chicago20
 Robert Stephen Hill (Robert Hill)合作论文数School of Biological Sciences, Faculty of Sciences, Engineering and Technology, University of Adelaide19Mg Hauser合作论文数18
 Mark Halpern合作论文数Department of Physics & Astronomy, Faculty of Science, The University of British Columbia18
 Edward L. (Ned) Wright合作论文数University of California, Los Angeles18
 Charles L. Bennett合作论文数Center for Astrophysical Science, Department of Physics and Astronomy, Krieger School of Arts and Sciences, Johns Hopkins University16T. Kelsall合作论文数15
 Jo Dunkley合作论文数Department of Astrophysical Sciences, Princeton University15
 Eli Dwek合作论文数Observational Cosmology Laboratory, Goddard Space Flight center, National Aeronautics and Space Administration14T. J. Sodroski合作论文数13
 Ben Gold合作论文数13Richard G. Arendt合作论文数12Rf Silverberg合作论文数11
 Davin Larson合作论文数Space Sciences Laboratory, University of California, Berkeley11
 Samuel H. Moseley合作论文数Goddard Space Flight Center, National Aeronautics and Space Administration9
 William Reach合作论文数Space Science Institute7Michael R Greason合作论文数7thomas l murdock合作论文数6El Wright合作论文数6
 Hiranya Peiris合作论文数Department of Physics and Astronomy, University College London;Department of Physics, Stockholm University6
 Licia Verde合作论文数Institut de Ciencies del Cosmos, Facultad de Fisica, Universitat de Barcelona;ICREA6
 Olivier Doré合作论文数Jet Propulsion Laboratory, National Aeronautics and Space Administration;The Division of Physics, Mathematics and Astronomy, California Institute of Technology;Academia Sinica Institute of Astronomy and Astrophysics6
 Kendrick Smith合作论文数Perimeter Institute for Theoretical Physics6
 Rachel Bean合作论文数Department of Physics, The College of Arts & Sciences, Cornell University5N. Boggess合作论文数5Alan Kogut合作论文数5Lou Williams Page合作论文数4jan weiland合作论文数4Cris W Barnes合作论文数4
 David T Leisawitz合作论文数NASA Goddard Space Flight Center4
 Bruce Berriman合作论文数Infrared Processing and Analysis Center, California Institute of Technology;NASA's Jet Propulsion Laboratory4E. R. Seaquist合作论文数3
 W. F. Wall合作论文数3Henry Freudenreich合作论文数3
 Maria Salatino合作论文数Dipartimento di Fisica, Università di Roma “La Sapienza”,3
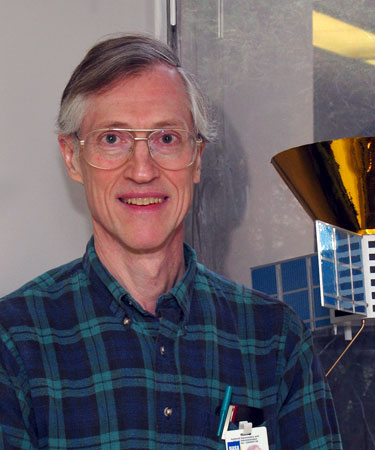 John C. Mather合作论文数Observational Cosmology Laboratory, Goddard Space Flight Center, National Aeronautics and Space Administration;University of Maryland3S. Burdick合作论文数2D. Fixsen合作论文数2




