Figure S13. Survival probability for neuroblastoma patients non-MYCN amplified tumors with tumoroid enriched gene expression programs. Related to Figure 5.
Figure S2. Trajectory analysis and joint alignment of TH-MYCN tumors and normal murine embryo trunk (E13.5). Related to Figure 2.
Spatially resolved transcriptomics (SRT) is transforming how we study tissues by measuring gene expression in cells in their spatial context. However, the field lacks robust methodological guidance on one of its most fundamental analytical steps: how to accurately segment cells and assign spatially localized transcripts to them. Major technical challenges include sparse molecular signals, transcript displacement, complex cellular morphologies, and the projection of three-dimensional tissue architecture onto two-dimensional imaging planes. These challenges make segmentation a major source of uncertainty, with errors that can propagate through downstream analyses and ultimately lead to misleading biological interpretations. Here, we argue that segmentation should be treated as a central unresolved problem in spatial omics rather than a routine preprocessing step. We review current approaches, highlight key methodological limitations, including the lack of appropriate metrics and gold-standard benchmarks, and propose a community-driven path forward. Establishing shared evaluation frameworks, scalable benchmark datasets, and transparent reporting standards will be essential for transforming SRT into a robust and reproducible foundation for biological discovery and clinical translation.
Figure S8. Homozygous and hemizygous ex vivo tumoroid cultures. Related to Figure 4.
Table S2 shows gene lists used for signature scores, corresponding to Fig. 2A and Fig. 5A.
Distinct regional functionality of the human cortex is orchestrated by diverse cellular and molecular processes, yet the underlying regulatory mechanisms remain poorly understood. We performed multiomic single-cell and spatial characterization of nine regions of the human cortex to define the gene regulatory networks and transcription factors that govern cell-type and region specificity. With the combined data of over three million cells, two striking patterns of cortical neuron specialization were uncovered: a rostral-caudal spatial pattern of calcium regulatory machinery, and subunit switching of multiple signaling receptor families across the transmodal-sensory axis. Gene regulatory network analysis revealed putative transcriptional regulators of cortical neuron specialization with cell-type- and region-specific gene regulation patterns. While regionalization was observed in gene expression, chromatin accessibility, and spatial distributions, these modalities exhibited distinct cortical patterns. Our findings illuminate critical neuronal pathways that vary throughout the cortex and the gene regulatory networks that establish cortical regionalization in the human brain.
Figure S3. TH-MYCN tumor microenvironment is composed of Schwannian and mesenchymal stroma, and a diverse immune-cell repertoire. Related to Figures 2 and 3.
Figure S1. Cell states and cell cycle phases are consistent across TH-MYCN samples and genotypes. Related to Figure 1.
The adult adrenal cortex undergoes constant renewal, yet underlying human-specific mechanisms remain poorly understood. Here we generated single-cell and spatial transcriptomic atlases of adult human and mouse adrenal glands, leveraging single-cell-resolution spatial data and a rare clonal mosaic case for lineage inference. In humans, we identified age-associated zona glomerulosa (ZG) cell states with direct cortisol synthesis capacity and sex-specific differences in inferred cholesterol balance. Cross-species comparison revealed conserved aldosterone-producing ZG but notable divergence in zona fasciculata markers, absence of zona reticularis homologs in mice and differential SHH-WNT4 signaling in proliferating cells. We uncovered human WT1- capsule-to-ZG transition and vascular smooth muscle cell-to-steroidogenic transitions supported by mosaic lineage evidence. We revealed dispersed proliferating cortical SF1+EZH2+ cells throughout the human cortex in contrast with ZG restriction in mice. Taken together, our data expand the centripetal renewal model and establish a comparative framework for human adrenocortical biology.
Figure S6. Identification of conserved and context-specific signaling pathways in tumors from NB patients and TH-MYCN mice.
Figure S14. Survival probability for neuroblastoma patients MYCN amplified tumors with tumoroid enriched gene expression programs. Related to Figure 5.
Table S1 shows characteristics of TH-MYCN mouse samples used for tumoroid cultures, scRNA-seq and immunostainings.
Figure S11. TH-MYCN tumoroids preserve transcriptomic and histological features of original tumors. Related to Figure 4.
Figure S7. Conserved signaling pathways, receptor-ligand interactions and survival analysis of NB patients.
Abstract Retrospective reconstruction of cell lineages from somatic mutations holds substantial promise for understanding development, tissue homeostasis, and disease. Yet, current approaches are often constrained by low marker density, technical noise, and incomplete molecular readouts that limit the resolution and accuracy of inferred lineages. Here, we present RETrace2, a single-cell dual-omic method for simultaneous lineage tracing and cell-type identification. By identifying and targeting highly mutable homopolymers, which we show are approximately twice as informative as conventional microsatellite repeats, combined with technical improvements to increase marker coverage and reduce experimental errors of reading and amplifying homopolymers, RETrace2 can trace lineage continuously at an estimated resolution of fewer than five cell divisions in microsatellite-unstable organisms. Simultaneously, sparse methylation profiles were obtained from the same cells for cell-type identification. We validated the method using in vitro ground-truth models and demonstrated its utility in vivo by reconstructing multi-organ lineage trees from the brain, kidney and liver of Msh2 -deficient mice.
Multiple system atrophy (MSA) is a rare, age-related neurodegenerative disease that shares clinical and pathological features with Parkinson's disease (PD) but presents a more devastating disease course. To elucidate the distinct cellular pathophysiology, we performed single-nucleus RNA sequencing on postmortem striatal brain tissue from 7 MSA and 12 PD patients, and 10 non-neurological cases. Here, we show significant compositional differences in astroglia and microglia subtypes, while oligodendroglia and neurons are comparable. PD brains show abundant microglia expressing MHC class II HLA haplotypes, indicative of a proinflammatory state, alongside more homeostatic astrocytes. In contrast, MSA lack activated microglia but has more reactive astrocytes compared to PD. Transcriptomic analysis suggests compromised oligodendrocyte signaling in MSA, with microglia being in a state of immune tolerance or exhaustion. Microglia derived from iPSC exposed to patient cerebrospinal fluid exhibit reduced phagocytic activity, especially in MSA. These findings underscore a dysfunctional immune response in MSA as a potential contributor to the more severe pathophysiology of MSA.
Assays coupling high-throughput lineage tracing with single-cell transcriptomics are transforming studies of development and disease biology, revealing not only major differentiation routes but also continuous fate biases and their putative regulators. Yet, analysis of such data at scale presents challenges due to the sparse nature of clonal data and annotation dependencies. Towards that aim we developed a machine learning approach - clone2vec - which learns informative clone embeddings directly from the cellular expression manifold, bypassing discrete cell-type labels and remaining stable when clones are represented by few cells. This representation summarizes clonal variation as an interpretable geometry that supports exploration, statistics for clone-gene associations, and cross-dataset alignment. In prospective barcoding datasets spanning embryogenesis, tumorigenesis, and hematopoiesis, clone2vec recapitulates established clonal patterns and uncovers new axes of continuous variation that implicate regulatory programs and developmental pathways. In tumor microenvironments profiled with TCR sequencing, clone2vec robustly recovers distinct Treg lineages as well as conserved CD8+ T cell sublineages across cancer types, including several bystander-like clonal subsets. Overall, clone2vec provides a robust, general solution for the exploratory analysis of lineage-coupled scRNA-seq data.
Figure S12. Distinct ex vivo tumoroid enriched cluster embedding and expression patterns. Related to Figure 5.
 Shenglin Mei合作论文数Harvard Medical School/ MGH, Boston, United States.40
 Ninib Baryawno合作论文数34
 Igor Adameyko合作论文数Department of Medical Biochemistry and Biophysics, Karolinska Institute31
 Hirak Sarkar合作论文数25
 Thale Kristin Olsen合作论文数Karolinska Inst, Dept Women s & Children s Hlth, Childhood Canc Res Unit, Stockholm, Sweden25
 Per Kogner合作论文数Institutionen För Kvinnors Och Barns Hälsa, Karolinska Institutet;Karolinska University Hospital25
 John Inge Johnsen合作论文数24P.A. Kameneva合作论文数23
 Joerg Otte合作论文数22
 Natalia Akkuratova合作论文数21
 Viktor Petukhov合作论文数University of Copenhagen20
 Peter J Park合作论文数Department of Biomedical Informatics, Harvard Medical School;Division of Genetics, Brigham and Women’s Hospital20
 Artemov Artem V合作论文数20Conny Tümmler合作论文数18Malin Wickstrom合作论文数Department of Medical Sciences, Clinical Chemistry and Pharmacology, Akademiska Hospital18Evan Biederstedt合作论文数17
 Jean Fan合作论文数Department of Biomedical Engineering, Whiting School of Engineering, Johns Hopkins University15
 David Scadden合作论文数Department of Stem Cell and Regenerative Biology, Harvard University;Center for Regenerative Medicine, Massachusetts General Hospital15Barkas Nikolaos合作论文数14Ruslan Soldatov合作论文数Harvard Med Sch, Dept Biomed Informat, Boston, MA 02115 USA13
 Artyom A Alekseyenko合作论文数13
 Kun Zhang合作论文数Department of Bioengineering, Jacobs School of Engineering, University of California, San Diego;Institute of Engineering in Medicine, University of California, San Diego;Altos Labs;Singlera Genomics12
 Catherine J. Wu合作论文数Department of Medical Oncology, Dana-Farber Cancer Institute;Division of Stem Cell Transplantation and Cellular Therapies, Dana-Farber Cancer Institute;Harvard Medical School11
 Mitzi I. Kuroda合作论文数Division of Medical Sciences, Department of Genetics, Harvard Medical School, Harvard University;Blavatnik Institute, Department of Genetics, Harvard Medical School, Harvard University11
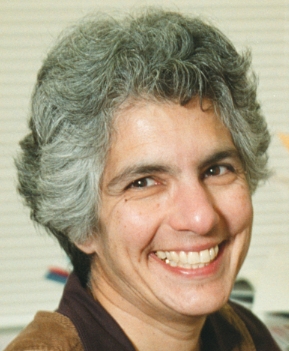 Donna Neuberg合作论文数Department of Biostatistics, Harvard T.H. Chan School of Public Health;Dana-Farber Cancer Institute11
 Gustafsson Karin合作论文数Department of Medical Cell Biology, Uppsala University10
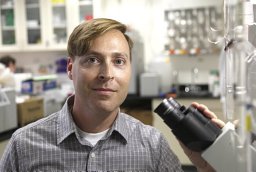 Lake Blue B合作论文数Dept Bioengn, Univ Calif San Diego9
 Konstantin Khodosevich合作论文数Shemyakin-Ovchinnikov Institute of Bioorganic Chemistry, Russian Academy of Sciences9
 Jerold Chun合作论文数Sanford Burnham Prebys Medical Discovery Institute;UC San Diego8Andrey A. Gorchakov合作论文数Institute of Cytology and Genetics of Siberian Division;Russian Academy of Sciences;Institute of Cytology and Genetics of Siberian Division, Russian Academy of Sciences8
 Qiwen Hu合作论文数8
 Aki Minoda合作论文数Department of Genome Dynamics, Lawrence Berkeley National Laboratory (LBNL),;null;Computer Science and Artificial Intelligence Laboratory, Massachusetts Institute of Technology (MIT),;Broad Institute of MIT and Harvard, Cambridge, MA 02140, USA.;Center for Biomedical Informatics, Harvard Medical School;Institute for Genomics and Systems Biology, The University of Chicago;Department of Pharmacology and Cancer Biology, Duke University Medical Center;Department of Molecular Genetics, University of Toronto;Sloan-Kettering Institute;Genome Sciences Division, LBNL;Department of Genetics and Cambridge Systems Biology Centre, University of Cambridge;Brigham and Women’s Hospital, Harvard Medical School;National Institute of Diabetes and Digestive and Kidney Diseases (NIDDK),, National Institutes of Health (NIH),;Cold Spring Harbor Laboratory;Department of Genetics and Developmental Biology, University of Connecticut Stem Cell Institute;Department of Biology CB-1137, Washington University;Affymetrix, Santa Clara, CA 95051, USA.;Division of Extramural Research, National Human Genome Research Institute;Ontario Institute for Cancer Research;Department of Genetics and <em>Drosophila</em> RNAi Screening Center, Harvard Medical School;Center for Genome Sciences, Washington University;Department of Biology, Indiana University;Whitehead Institute;Hubrecht Institute, University Medical Center Utrecht;Center for Genomics and Bioinformatics, Indiana University;Basic Sciences Division, Fred Hutchinson Cancer Research Center;Section of Cell and Developmental Biology, University of California San Diego;Department of Molecular Biology and Biochemistry, Rutgers University;Department of Molecular and Cell Biology, University of California;Department of Biological Chemistry and Molecular Pharmacology, Harvard Medical School;Machine Learning Group, Université Libre de Bruxelles;Massachusetts General Hospital Cancer Center, Harvard Medical School;Department of Plant and Microbial Biology, University of California;Computer and Information Science and Engineering, University of Florida;School of Engineering and Howard Hughes Medical Institute (HHMI),, University of California Santa Cruz;Institute of MIT and Harvard, Massachusetts Institute of Technology (MIT),7
 Brian D. Sykes合作论文数Department of Biochemistry,Faculty of Medicine & Dentistry,University of Alberta7Maria-Eleni Kastriti合作论文数7Philip J. Saylor合作论文数7Youmna Kfoury合作论文数Faculty of Medicine, American University of Beirut7Adele Alchahin合作论文数6Shuqiang Li合作论文数6
 Tingting Gu (顾婷婷)合作论文数College of Horticulture, Nanjing Agricultural University6
 Sachet Shukla合作论文数Department of Hematopoietic Biology Malignancy, Graduate School of Biomedical Sciences, The University of Texas MD Anderson Cancer Center;Broad Institute6
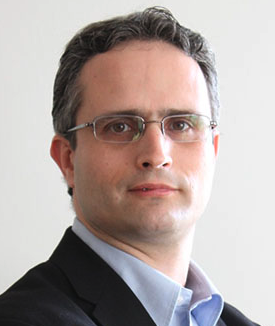 Gad A. Getz合作论文数Harvard Medical School;Department of Pathology, Massachusetts General Hospital;Broad Institute of Harvard and MIT6
 Taghreed Hirz合作论文数Faculty of Medicine, AUB6
 Evan Macosko合作论文数Massachusetts General Hospital;Harvard Medical School;Mass General Research Institute;Broad Institute, Massachusetts Institute of Technology6
 Nicole C. Riddle合作论文数Washington University;Department of Biology;Department of Biology, Washington University6Anna A Igolkina合作论文数Austrian Acad Sci, Gregor Mendel Inst, Vienna BioCtr5Rasmus Rydbirk合作论文数Bispebjerg and Frederiksberg Hospital5Satyen Gohil合作论文数5
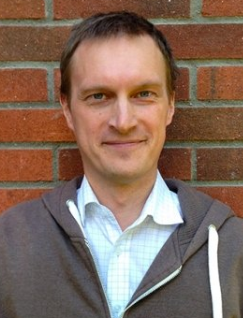 Sten Linnarsson合作论文数Department of Medical Biochemistry and Biophysics, Karolinska Institutet5Daniel S. Day合作论文数Center for Biomedical Informatics, Harvard Medical School;Division of Health Sciences and Technology, Massachusetts Institute of Technology;Harvard Medical School, Harvard/Massachusetts Institute of Technology5




