NASA's Student Airborne Research Program (SARP) has completed 13 years of airborne student research since its inception in 2009. The 8-week summer internship program provides students, typically rising undergraduate seniors, with an opportunity to get hands-on experience in making Earth system measurements using NASA's airborne science platforms. Students also make complementary surface-based measurements, analyze airborne and surface data in the context of related data (e.g. coincident satellite measurements or prior-year SARP data), and present results to peers, program leadership, agency management, and the community. The program splits its time between the NASA Armstrong flight facility in Palmdale, California, and the University of California, Irvine. It is implemented with participation of faculty advisors (who provide many of the instruments used) and graduate student mentors, under the overall leadership of the NASA Earth Science Division. Disciplinary foci include atmospheric gases and aerosols, ocean biology, and terrestrial ecology using both in situ and remote sensing instruments. Students are also taken on site visits to nearby laboratories and facilities and attend lectures from visiting faculty and NASA agency personnel. The program engages approximately 30 students per year, with overall approximate gender balance. The program has a high rate of STEM retention, and its alumni are actively engaged in graduate and postgraduate programs in Earth system science and other disciplines. A summary of scientific and programmatic outcomes and a description of how the program has evolved will be presented.
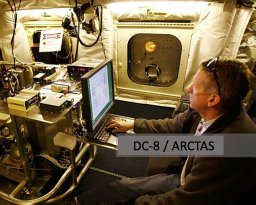
A focus of the Arctic Research of the Composition of the Troposphere from Aircraft and Satellites (ARCTAS) mission was examination of bromine photochemistry in the spring time high latitude troposphere based on aircraft and satellite measurements of bromine oxide (BrO) and related species. The NASA DC-8 aircraft utilized a chemical ionization mass spectrometer (CIMS) to measure BrO and a mist chamber (MC) to measure soluble bromide. We have determined that the MC detection efficiency to molecular bromine (Br2), hypobromous acid (HOBr), bromine oxide (BrO), and hydrogen bromide (HBr) as soluble bromide (Br−) was 0.9±0.1, 1.06+0.30/−0.35, 0.4±0.1, and 0.95±0.1, respectively. These efficiency factors were used to estimate soluble bromide levels along the DC-8 flight track of 17 April 2008 from photochemical calculations constrained to in situ BrO measured by CIMS. During this flight, the highest levels of soluble bromide and BrO were observed and atmospheric conditions were ideal for the space-borne observation of BrO. The good agreement (R2 = 0.76; slope = 0.95; intercept = −3.4 pmol mol−1) between modeled and observed soluble bromide, when BrO was above detection limit (>2 pmol mol−1) under unpolluted conditions (NO<10 pmol mol−1), indicates that the CIMS BrO measurements were consistent with the MC soluble bromide and that a well characterized MC can be used to derive mixing ratios of some reactive bromine compounds. Tropospheric BrO vertical column densities (BrOVCD) derived from CIMS BrO observations compare well with BrOTROPVCD from OMI on 17 April 2008.
Detailed comparisons of airborne CH2O measurements acquired by tunable diode laser absorption spectroscopy with steady state box model calculations were carried out using data from the 2006 INTEX-B and MILARGO campaign in order to improve our understanding of hydrocarbon oxidation processing. This study includes comparisons over Mexico (including Mexico City), the Gulf of Mexico, parts of the continental United States near the Gulf coast, as well as the more remote Pacific Ocean, and focuses on comparisons in the boundary layer. Select previous comparisons in other campaigns have highlighted some locations in the boundary layer where steady state box models have tended to underpredict CH2O, suggesting that standard steady state modeling assumptions might be unsuitable under these conditions, and pointing to a possible role for unmeasured hydrocarbons and/or additional primary emission sources of CH2O. Employing an improved instrument, more detailed measurement-model comparisons with better temporal overlap, up-to-date measurement and model precision estimates, up-to-date rate constants, and additional modeling tools based on both Lagrangian and Master Chemical Mechanism (MCM) runs, we have explained much of the disagreement between observed and predicted CH2O as resulting from non-steady-state atmospheric conditions in the vicinity of large pollution sources, and have quantified the disagreement as a function of plume lifetime (processing time). We show that in the near field (within ~4 to 6 h of the source), steady-state models can either over-or-underestimate observations, depending on the predominant non-steady-state influence. In addition, we show that even far field processes (10–40 h) can be influenced by non-steady-state conditions which can be responsible for CH2O model underestimations by ~20%. At the longer processing times in the 10 to 40 h range during Mexico City outflow events, MCM model calculations, using assumptions about initial amounts of high-order NMHCs, further indicate the potential importance of CH2O produced from unmeasured and multi-generation hydrocarbon oxidation compounds, particularly methylglyoxal, 3-hydroxypropanal, and butan-3-one-al.
Ultraviolet (UV) actinic fluxes measured with two Scanning Actinic Flux Spectroradiometers (SAFS) aboard the NASA DC-8 aircraft are compared with the Tropospheric Ultraviolet-Visible (TUV) model. The observations from 17 days in July-August 2004 (INTEX-NA field campaign) span a wide range of latitudes (28 degrees N-53 degrees N), longitudes (45 degrees W-140 degrees W), altitudes (0.1-11.9 km), ozone columns (285-353 DU), and solar zenith angles (2 degrees-85 degrees). Both cloudy and cloud-free conditions were encountered. For cloud-free conditions, the ratio of observed to clear-sky-model actinic flux (integrated from 298 to 422 nm) was 1.01 +/- 0.04, i.e. in good agreement with observations. The agreement improved to 1.00 +/- 0.03 for the down-welling component under clear sky conditions. In the presence of clouds and depending on their position relative to the aircraft, the up-welling component was frequently enhanced (by as much as a factor of 8 relative to cloud-free values) while the down-welling component showed both reductions and enhancements of up to a few tens of percent. Including all conditions, the ratio of the observed actinic flux to the cloud-free model value was 1.1 +/- 0.3 for the total, or separately 1.0 +/- 0.2 for the down-welling and 1.5 +/- 0.8 for the up-welling components. The correlations between up-welling and down-welling deviations are well reproduced with sensitivity studies using the TUV model, and are understood qualitatively with a simple conceptual model. This analysis of actinic flux observations illustrates opportunities for future evaluations of photolysis rates in three-dimensional chemistry-transport models.
In the summer of 2007, the NASA DC‐8 aircraft took part in the Tropical Composition, Cloud and Climate Coupling campaign based in San Jose, Costa Rica. During this campaign, multiple in situ and remote‐sensing instruments aboard the aircraft measured the atmospheric composition of the tropical tropopause layer (TTL) in the equatorial region around Central and South America. During the 17 July flight off the Ecuadorian coast, well‐defined “bubbles” of anomalously low‐ozone concentration (less than 75 ppbv) were detected above the aircraft in the TTL at the altitude near 365 K (between 14 and 16 km) and at ∼3°S and ∼82°W. Backward trajectories from meteorological analyses and the aircraft in situ measurements suggest that the ozone‐depleted air mass originated from deep convection in the equatorial eastern Pacific and/or Panama Bight regions at least 5 days before observation by the DC‐8; this was not a feature produced by local convection. Given uncertainties known in regard to trajectories calculated from global reanalysis, it is not possible to identify the exact convective system that produced this particular low‐ozone anomaly, but only the general origin from a region of high convective activity. However, the fact that the feature apparently maintained its coherency for at least 5 days suggests a significant contribution to the chemical composition of the tropical upper troposphere portion of the TTL from convective systems followed by quasi‐horizontal transport. It also suggests that mixing time scales for these relatively small spatial features are greater than 5 days.
Abstract. The Sulfur Transport and dEposition Model (STEM) is applied to the analysis of observations obtained during the Intercontinental Chemical Transport Experiment-Phase B (INTEX-B), conducted over the eastern Pacific Ocean during spring 2006. Predicted trace gas and aerosol distributions over the Pacific are presented and discussed in terms of transport and source region contributions. Trace species distributions show a strong west (high) to east (low) gradient, with the bulk of the pollutant transport over the central Pacific occurring between ~20° N and 50° N in the 2–6 km altitude range. These distributions are evaluated in the eastern Pacific by comparison with the NASA DC-8 and NSF/NCAR C-130 airborne measurements along with observations from the Mt. Bachelor (MBO) surface site. Thirty different meteorological, trace gas and aerosol parameters are compared. In general the meteorological fields are better predicted than gas phase species, which in turn are better predicted than aerosol quantities. PAN is found to be significantly overpredicted over the eastern Pacific, which is attributed to uncertainties in the chemical reaction mechanisms used in current atmospheric chemistry models in general and to the specifically high PAN production in the SAPRC-99 mechanism used in the regional model. A systematic underprediction of the elevated sulfate layer in the eastern Pacific observed by the C-130 is another issue that is identified and discussed. Results from source region tagged CO simulations are used to estimate how the different source regions around the Pacific contribute to the trace gas species distributions. During this period the largest contributions were from China and from fires in South/Southeast and North Asia. For the C-130 flights, which operated off the coast of the Northwest US, the regional CO contributions range as follows: China (35%), South/Southeast Asia fires (35%), North America anthropogenic (20%), and North Asia fires (10%). The transport of pollution into the western US is studied at MBO and a variety of events with elevated Asian dust, and periods with contributions from China and fires from both Asia and North America are discussed. The role of heterogeneous chemistry on the composition over the eastern Pacific is also studied. The impacts of heterogeneous reactions at specific times can be significant, increasing sulfate and nitrate aerosol production and reducing gas phase nitric acid levels appreciably (~50%).
R. Yokelson, J. D. Crounse, P. F. DeCarlo, T. Karl, S. Urbanski, E. Atlas, T. Campos, Y. Shinozuka, V. Kapustin, A. D. Clarke, A. Weinheimer, D. J. Knapp, D. D. Montzka, J. Holloway, P. Weibring, F. Flocke, W. Zheng, D. Toohey, P. O. Wennberg, C. Wiedinmyer, L. Mauldin, A. Fried, D. Richter, J. Walega, J. L. Jimenez, K. Adachi, P. R. Buseck, S. R. Hall, and R. Shetter University of Montana, Department of Chemistry, Missoula, MT 59812, USA Division of Chemistry and Chemical Engineering, California Institute of Technology, Pasadena, USA University of Colorado, Cooperative Institute for Research in the Environmental Sciences (CIRES), and Department of Atmospheric and Oceanic Sciences, Boulder, USA Now at the Paul Scherrer Institut, Villigen Switzerland National Center for Atmospheric Research, Boulder, CO, USA USDA Forest Service, Fire Sciences Laboratory, Missoula, MT, USA University of Miami, Rosenstiel School of Marine and Atmospheric Science, USA School of Ocean and Earth Sciences and Department of Oceanography, University of Hawaii, Honolulu, USA
Abstract. The Sulfur Transport and dEposition Model (STEM) developed at the University of Iowa is applied to the analysis of observations obtained during the Intercontinental Chemical Transport Experiment-Phase B (INTEX-B), conducted over the Pacific Ocean during the 2006 North American spring season. This paper reports on the model performance of meteorological parameters, trace gases, aerosols and photolysis rate (J-values) predictions with the NASA DC-8 and NSF/NCAR C-130 airborne measurements along with observations from three surface sites Mt. Bachelor, Trinidad Head and Kathmandu, Nepal. In general the model shows appreciable skill in predicting many of the important aspects of the observed distributions. The major meteorological parameters driving long range transport are accurately predicted by the WRF simulations used in this study. Furthermore, the STEM model predicts aerosols and trace gases concentrations within a standard deviation of most of the observed mean values. The results also point towards areas where model improvements are needed; e.g., the STEM model underestimates CO (15% for the DC8 and 6% for the C-130), whereas it overpredicts PAN (by a factor of two for both aircraft). The errors in the model calculations are attributed to uncertainty in emissions estimates and uncertainty in the top and lateral boundary conditions. Results from a series of sensitivity simulations examining the impact of the growth of emissions in Asia from 2000 to 2006, the importance of biomass burning, the effect of using boundary conditions from different global models, and the role of heterogeneous chemistry on the predictions are also presented. The impacts of heterogeneous reactions at specific times during dust transport episodes can be significant, and in the presence of dust both sulfate and nitrate aerosol production is increased and gas phase nitric acid levels are reduced appreciably (~50%). The aging of the air masses during the long range transport over the Pacific and the impact of various sources (source regions as well as energy and biomass burning) on targeted observations are analyzed using back-trajectories and tagged CO-tracer analysis.
Abstract. In March 2006 two instrumented aircraft made the first detailed field measurements of biomass burning (BB) emissions in the Northern Hemisphere tropics as part of the MILAGRO project. The aircraft were the National Center for Atmospheric Research C-130 and a University of Montana/US Forest Service Twin Otter. The initial emissions of up to 49 trace gas or particle species were measured from 20 deforestation and crop residue fires on the Yucatan peninsula. This included two trace gases useful as indicators of BB (HCN and acetonitrile) and several rarely, or never before, measured species: OH, peroxyacetic acid, propanoic acid, hydrogen peroxide, methane sulfonic acid, and sulfuric acid. Crop residue fires emitted more organic acids and ammonia than deforestation fires, but the emissions from the main fire types were otherwise fairly similar. The Yucatan fires emitted unusually high amounts of SO2 and particle chloride, likely due to a strong marine influence on this peninsula. As smoke from one fire aged, the ratio ΔO3/ΔCO increased to ~15% in 1×10⁷ molecules/cm3) that were likely caused in part by high initial HONO (~10% of NOy). Thus, more research is needed to understand critical post emission processes for the second-largest trace gas source on Earth. It is estimated that ~44 Tg of biomass burned in the Yucatan in the spring of 2006. Mexican BB (including Yucatan BB) and urban emissions from the Mexico City area can both influence the March-May air quality in much of Mexico and the US.
The measurement of OH reactivity, the inverse of the OH lifetime, provides a powerful tool to investigate atmospheric photochemistry. A new airborne OH reactivity instrument was designed and deployed for the first time on the NASA DC-8 aircraft during the second phase of Inter- continental Chemical Transport Experiment-B (INTEX-B) campaign, which was focused on the Asian pollution out- flow over Pacific Ocean and was based in Hawaii and Alaska. The OH reactivity was measured by adding OH, generated by photolyzing water vapor with 185 nm UV light in a moveable wand, to the flow of ambient air in a flow tube and mea- suring the OH signal with laser induced fluorescence. As the wand was pulled back away from the OH detector, the OH signal decay was recorded; the slope of 1ln(signal)/1 time was the OH reactivity. The overall absolute uncer- tainty at the 2 confidence levels is about 1 s 1 at low al- titudes (for decay about 6 s 1 ), and 0.7 s 1 at high altitudes (for decay about 2 s 1 ). From the median vertical profile obtained in the second phase of INTEX-B, the measured OH reactivity (4.0±1.0 s 1 ) is higher than the OH reactiv-
Measurements of formaldehyde (CH2O) from a tunable diode laser absorption spectrometer (TDLAS) were acquired onboard the NASA DC‐8 aircraft during the summer 2004 INTEX‐NA campaign to test our understanding of convection and CH2O production mechanisms in the upper troposphere (UT, 6–12 km) over continental North America and the North Atlantic Ocean. The present study utilizes these TDLAS measurements and results from a box model to (1) establish sets of conditions by which to distinguish “background” UT CH2O levels from those perturbed by convection and other causes; (2) quantify the CH2O precursor budgets for both air mass types; (3) quantify the fraction of time that the UT CH2O measurements over North America and North Atlantic are perturbed during the summer of 2004; (4) provide estimates for the fraction of time that such perturbed CH2O levels are caused by direct convection of boundary layer CH2O and/or convection of CH2O precursors; (5) assess the ability of box models to reproduce the CH2O measurements; and (6) examine CH2O and HO2 relationships in the presence of enhanced NO. Multiple tracers were used to arrive at a set of UT CH2O background and perturbed air mass periods, and 46% of the TDLAS measurements fell within the latter category. In general, production of CH2O from CH4 was found to be the dominant source term, even in perturbed air masses. This was followed by production from methyl hydroperoxide, methanol, PAN‐type compounds, and ketones, in descending order of their contribution. At least 70% to 73% of the elevated UT observations were caused by enhanced production from CH2O precursors rather than direct transport of CH2O from the boundary layer. In the presence of elevated NO, there was a definite trend in the CH2O measurement–model discrepancy, and this was highly correlated with HO2 measurement–model discrepancies in the UT.
 Barry Lefer合作论文数Department of Earth and Atmospheric Sciences, University of Houston64
 Christopher Cantrell合作论文数Department of Atmospheric and Oceanic Sciences, College of Arts and Sciences, University of Colorado Boulder52
 James Crawford合作论文数Langley Research Center, National Aeronautics and Space Administration43
 William H. Brune合作论文数Department of Meteorology and Atmospheric Science, College of Earth and Mineral Sciences, Pennsylvania State University41
 Donald R. Blake合作论文数Department of Chemistry, School of Physical Sciences, University of California, Irvine;Department of Earth System Science, School of Physical Sciences, University of California, Irvine39
 Brian G. Heikes合作论文数Graduate School of Oceanography, University of Rhode Island38
 Hanwant B. Singh合作论文数Atmospheric Science Branch, NASA Ames Research Center29
 Melody Avery合作论文数Science Directorate, NASA Langley Research Center29
 Samuel Hall合作论文数Atmospheric Chemistry Observations & Modeling Lab, National Center for Atmospheric Research, University Corporation for Atmospheric Research28Alan Fried合作论文数28
 Jack Dibb合作论文数Earth Systems Research Center, Institute of Earth, Oceans and Space, University Of New Hampshire28
 F. Flocke合作论文数Atmospheric Chemistry Division, National Center for Atmospheric Research27
 Dawn D Davis合作论文数24
 Andrew J. Weinheimer合作论文数Boulder24
 Ronald C. Cohen合作论文数Department of Chemistry, College of Chemistry, University of California, Berkeley;Department of Earth & Planetary Science, University of California, Berkeley;Energy and Environment Technologies Division, LBNL21F. Eisele合作论文数21
 Lee Mauldin合作论文数Department of Atmospheric and Oceanic Sciences, College of Arts and Sciences, University of Colorado Boulder20
 Elliot Atlas合作论文数Department of Atmospheric Sciences, Rosenstiel School, University of Miami20
 Robert Talbot合作论文数Department of Earth and Atmospheric Sciences, College of Natural Sciences and Mathematics, University of Houston20
 Nicola J. Blake合作论文数Department of Chemistry, University of California20
 John D. Barrick合作论文数19A. Fried合作论文数18G. Chen合作论文数18Fred L. Eisele合作论文数17
 L. Gregory Huey合作论文数Atmospheric Sciences, Georgia Institute of Technology;School of Earth &17
 Edward V. Browell合作论文数NASA Langley Research Center17Spencer R. Hall合作论文数School of Integrative Biology, University of Illinois15
 Sasha Madronich合作论文数Atmospheric Chemistry Observations and Modeling Laboratory, National Center for Atmospheric Research15
 Scott Thomas Sandholm合作论文数15Hartwig Harder合作论文数15J. Walega合作论文数13JR Olson合作论文数13Glen W Sachse合作论文数13
 Julie A. Snow合作论文数Graduate School of Oceanography, University of Rhode Island13Mark A. Zondlo合作论文数National Center for Atmospheric Research13Stephanie A. Vay合作论文数13
 Glen W. Sachse合作论文数12
 Glenn Diskin合作论文数Langley Research Center, National Aeronautics and Space Administration12D. Tan合作论文数12
 Xinrong Ren合作论文数Air Resources Laboratory, NOAA;Department of Atmospheric and Oceanic Science, University of Maryland College Park12Y. Kondo合作论文数11
 Teresa Campos合作论文数Atmospheric Chemistry Observations & Modeling Lab, National Center for Atmospheric Research11Paul Wooldridge合作论文数Department of Chemistry, University of California, Berkeley11Eric C Apel合作论文数11L. Mauldin合作论文数10Ja Davidson合作论文数10
 Greg Huey合作论文数School of Chemistry and Biochemistry, College of Sciences, Georgia Institute of Technology;School of Earth and Atmospheric Sciences, College of Sciences, Georgia Institute of Technology10Brian Ridley合作论文数10Edward Kosciuch合作论文数10




