Abstract. The coastal Ocean Data Analysis Product in North America (CODAP-NA, Version 2026) represents a major expansion of coastal ocean carbonate chemistry synthesis for North American continental margins. Compared to CODAP-NA Version 2021, the updated product integrates newly available cruise observations spanning more than four decades, substantially increasing both the spatial and temporal coverage of coastal biogeochemical measurements across North American continental shelves. Observations from multiple research programs have been harmonized into a unified, internally consistent format through standardized quality control procedures, enabling large-scale analyses of ocean carbon cycling and ocean acidification along the North American margins. This version comprises 446 cruises, 31,864 hydrographic profiles, and 195,489 discrete data records covering continental shelf environments from Alaska to Mexico in the west and from Canada to the Caribbean in the east from 1981 to 2024. Fourteen variables (including temperature, salinity, dissolved oxygen, dissolved inorganic carbon, total alkalinity, pH on the Total Scale, carbonate ion, fugacity of carbon dioxide, silicate, phosphate, nitrate, nitrite, nitrate plus nitrite, and ammonium) were subjected to extensive quality control. CODAP-NA Version 2026 is available as a merged data product in CSV, MATLAB, and NetCDF formats (https://doi.org/10.25921/h2ff-9d66) through the NOAA Ocean Carbon and Acidification Data System (OCADS: https://www.ncei.noaa.gov/data/oceans/ncei/ocads/metadata/0315529.html). The original cruise data were archived and are accessible via a summary table at the NCEI Ocean Acidification Data Stewardship repository (https://www.ncei.noaa.gov/access/ocean-carbon-acidification-data-system/synthesis/CODAP-NAv2.html).
Abstract The 2014 discovery of living deep‐sea coral reefs along the Northwest Hawaiian Islands (NWHI) and lower Emperor Seamount Chain (ESC), despite the North Pacific's shallow aragonite saturation horizon (ASH) and high CaCO 3 dissolution rates, underscores the need to understand the local seawater chemistry where these reefs persist. We investigated seawater carbonate chemistry using discrete samples along NWHI and ESC from two cruises ∼1 year apart (08/26/21–09/26/21, 09/09/22–10/24/22). Across the two cruises, ASH depth difference ranged from 15 to 77 m. Since the Pacific ASH shoals by 1–2 m yr −1 , this long‐term trend cannot explain the magnitude of ASH change observed. Potential contributions from anthropogenic CO 2 and examining intermediate water mass changes from temperature‐salinity plots did not provide an explanation for the observed changes. Instead, ASH depth variability was primarily governed by localized biogeochemical processes, namely changes in intermediate water respiration and CaCO 3 dissolution. Indicators for dissolution (TA*) and respiration (AOU) suggest changes in ASH depth were driven by changes in dissolution at the northern‐ and southern‐most sites, whereas respiration exerted stronger control at central sites. Combining 2021 and 2022 data with data from 2014 to 2019 revealed high interannual ASH variability, by as much as >200 m. Deep‐sea coral reefs across the NWHI and ESC currently reside close to the ASH depth and likely experience interannual shifts between under‐ and supersaturation. As ocean acidification induced shoaling occurs alongside these interannual fluctuations, the frequency of undersaturation will be an important consideration for deep‐sea coral reef longevity.
Abstract The California Current System (CCS) is a globally recognized source of nitrous oxide (N 2 O), a potent greenhouse gas to the atmosphere; however, little is known about the underlying sources of N 2 O within the CCS. During the 2021 NOAA West Coast Ocean Acidification cruise, we collected samples for N 2 O and nitrate (NO 3 − ) concentration and isotope ratio measurements–from Dana Point, California (31.78°N) to Haida Gwaii, Canada (52.40°N)–to understand what processes shape the distribution of N 2 O in the CCS and subsequent emissions. Throughout the primary range of the subsurface California Undercurrent (CUC), with potential density anomalies of 26–27 kg m −3 , we observed elevated 15 N/ 14 N in both NO 3 − and N 2 O, corresponding with negative N*. These signals of nitrogen loss and N 2 O production from denitrification are indicative of northward transport of waters from eastern tropical North Pacific oxygen deficient zone throughout the CUC. Together with contemporaneous data from an underwater glider network, we observed strong upwelling of CUC waters between Pt. Conception and Cape Mendocino in California, corresponding with high surface density and excess N 2 O concentrations, leading to large N 2 O fluxes to the atmosphere (as high as 48 μmol m −2 d −1 ). Thus, the tracers employed in this study link CUC transport to N 2 O emissions to the atmosphere during the summer upwelling season. Because the CUC is projected to expand and shoal in response to climate change, this source of N 2 O could be enhanced under these conditions.
Accurate assessment of anthropogenic carbon dioxide (CO2) emissions and their redistribution among the atmosphere, ocean, and terrestrial biosphere in a changing climate is critical to better understand the global carbon cycle, support the development of climate policies, and project future climate change. Here we describe and synthesise datasets and methodologies to quantify the five major components of the global carbon budget and their uncertainties. Fossil CO2 emissions (E-FOS) are based on energy and cement production data. Emissions from land-use change (E-LUC) are estimated by bookkeeping models based on land-use data. The global atmospheric CO2 growth rate (G(ATM)) is computed from changes in concentration measured at surface stations. The global net uptake of CO2 by the ocean (S-OCEAN) is estimated with global ocean biogeochemistry models and observation-based fCO(2)-products. The global net uptake of CO2 by the land (S-LAND) is estimated with dynamic global vegetation models. Additional lines of evidence are provided by atmospheric inversions, atmospheric oxygen measurements, ocean interior observation-based estimates, and Earth System Models. This year, we introduced corrections on the E-LUC, S-OCEAN and S-LAND estimates. The sum of all sources and sinks results in the carbon budget imbalance (B-IM), a measure of imperfect data and incomplete understanding of the contemporary carbon cycle. All uncertainties are reported as +/- 1 sigma. For the year 2024, E-FOS increased by 1.1 % relative to 2023, with fossil emissions at 10.3 +/- 0.5 GtC yr(-1) (including the cement carbonation sink, 0.2 GtC yr(-1)), E-LUC was 1.3 +/- 0.7 GtC yr(-1), for total anthropogenic CO2 emissions of 11.6 +/- 0.9 GtC yr(-1) (42.4 +/- 3.2 GtCO(2) yr(-1)). Also, for 2024, G(ATM) was 7.9 +/- 0.2 GtC yr(-1) (3.73 +/- 0.1 ppm yr(-1)), 2.2 GtC above the 2023 growth rate. S-OCEAN was 3.4 +/- 0.4 GtC yr(-1) and S-LAND was 1.9 +/- 1.1 GtC yr(-1), leaving a large negative B-IM (-1.7 GtC yr(-1)), suggesting that the total sink or G(ATM) is strongly overestimated in 2024. The global atmospheric CO2 concentration averaged over 2024 reached 422.8 +/- 0.1 ppm. Preliminary data for 2025 suggest an increase in E-FOS relative to 2024 of +1.0 % (0.2 % to 1.7 %) globally, and atmospheric CO2 concentration increasing by 2.1 ppm reaching 425.6 ppm, 53 % above the pre-industrial level (around 278 ppm in 1750). Overall, the mean and trend in the components of the global carbon budget are consistently estimated over the period 1959-2024, with a near-zero overall budget imbalance, although discrepancies of up to around 1 GtC yr(-1) persist for the representation of annual to decadal variability in CO2 fluxes. Comparison of estimates from multiple approaches and observations shows: (1) a persistent large uncertainty in the estimate of land-use change emissions, (2) a low agreement between the different methods on the magnitude of the land CO2 flux in the northern extra-tropics, and (3) a discrepancy between the different methods on the mean ocean sink.
Coccolithophores, as calcifying phytoplankton, play a critical role in the global carbon cycle by producing calcium carbonate (CaCO3) in the ocean through their calcitic coccoliths. Here we examine Gephyrocapsa huxleyi (formerly Emiliania huxleyi) and related species abundance and genetic diversity along the West Coast of North America from samples taken on the 2021 NOAA West Coast Ocean Acidification (WCOA21) cruise, along the margin from British Columbia, Canada, to San Diego, California, USA. Significant carbonate chemistry gradients were observed across 17 transects, mostly in the onshore-offshore and north-to-south direction. Abundance and morphometrics of Gephyrocapsa spp. was evaluated using real-time PCR of mitochondrial cytochrome c oxidase subunit 3 (cox3) gene and by microscopy. Variation in PIC concentrations, G. huxleyi and related species abundance, and coccosphere thickness were found to be associated with the gradients in carbonate chemistry and nutrient concentrations (phosphate, nitrate, nitrite, ammonium) across stations sampled during the cruise. We identified 5 unique amplicon sequence variants (ASVs) of Gephyrocapsa spp. cox3 that systematically varied in relative abundance across the California Current System. Southern California locations had greater diversity in cox3 sequences than northerly locations. These analyses represent baselines for evaluation of the impacts of future environmental changes in coastal waters along this productive upwelling regime.
Ocean alkalinity enhancement is a proposed method of marine carbon dioxide removal that enhances the ocean’s uptake of atmospheric carbon dioxide (CO2) and converts it to dissolved bicarbonate for long-term ocean storage. This method of marine carbon dioxide removal has been gaining attention for its potential to durably (10,000+ years) store large amounts of CO2 (Gt + where 1 Gt = 1 × 10⁹ tons), while potentially ameliorating acidification in the vicinity of the alkalinity release. This study focuses on a novel release of electrochemically derived aqueous alkalinity into Sequim Bay, WA, through a previously established wastewater treatment plant (WWTP). This research was made possible through the collaboration of industry, academic, and federal partners, which enabled the establishment of an Ebb Carbon electrochemical mCDR system at the Pacific Northwest National Laboratory in Sequim, WA, for ocean alkalinity enhancement field trials. During these field trials, pH was measured across the WWTP system from the initial alkalinity dosing, throughout the WWTP, and at the outfall. We use the NBS scale for pH throughout this study as it is the scale used in discharge permit limits specified for WWTP and NPDES regulation and compliance monitoring. The background pHNBS of Sequim Bay seawater was between 7.5 and 7.7 for the November and February field tests. The mixing tank’s pHNBS was raised to the maximum value permitted for the WWTP (9.0) and maintained across the system (±0.2) during the outfall releases. At the outfall, the elevated pH and alkalinity was quickly diluted, such that the region with a measurable signal was limited to within ∼2.5 m of the discharge pipe. We were able to successfully monitor an increase in pHNBS across all four pulses of alkalinity-enhanced seawater discharge during the February 2025 field trial, with peak pHNBS values of 8.3 or 8.1, as recorded by outfall-adjacent YSI Exo 2 sonde and SAMI-pH sensors, respectively. The alkalinity-enhanced seawater did not measurably alter the surrounding waters’ temperature, salinity, turbidity, or oxygen. This study provides proof-of-concept for a conservative small-scale release of electrochemically generated alkalinity-enhanced seawater from a coastal outfall.
As a contribution to the second REgional Carbon Cycle Assessment and Processes effort, we compare net and anthropogenic sea‐air CO 2 fluxes, CO 2 accumulation rates in the ocean interior and their trends in the Pacific Ocean by analyzing results from state‐of‐the‐art observation‐based estimates and global ocean biogeochemistry models (GOBMs) over the period 1985–2018. The ensemble‐mean net CO 2 fluxes integrated over the Pacific (44°S–62°N) are −0.41 ± 0.12 PgC yr −1 from p CO 2 products and −0.51 ± 0.16 PgC yr −1 from GOBMs. The anthropogenic CO 2 flux from GOBMs (−0.71 ± 0.10 PgC yr −1 ) is 1.4 times as large as the net CO 2 flux, with particularly large anthropogenic uptake in the equatorial region (−0.34 ± 0.03 PgC yr −1 ) significantly offsetting the large natural CO 2 outgassing there (+0.72 ± 0.06 PgC yr −1 ). The basin‐wide net CO 2 uptake has increased at similar mean rates of −0.09 ± 0.06 and −0.08 ± 0.02 PgC yr −1 decade −1 in p CO 2 products and GOBMs, respectively, comparable with the increase in anthropogenic CO 2 uptake of −0.10 ± 0.01 PgC yr −1 decade −1 in GOBMs. However, a notable mismatch in the trend of the net CO 2 flux change that exists between p CO 2 products (+0.00 ± 0.02 PgC yr −1 decade −1 ) and GOBMs (−0.04 ± 0.01 PgC yr −1 decade −1 ) in the equatorial region is yet to be resolved. The rate of anthropogenic CO 2 accumulation from GOBMs is +0.76 ± 0.17 PgC yr −1 . This is nearly balanced with the anthropogenic CO 2 flux and is also encompassed by the previous observation‐based estimates.
Ocean acidification has been identified in the Planetary Boundary Framework as a planetary process approaching a boundary that could lead to unacceptable environmental change. Using revised estimates of pre-industrial aragonite saturation state, state-of-the-art data-model products, including uncertainties and assessing impact on ecological indicators, we improve upon the ocean acidification planetary boundary assessment and demonstrate that by 2020, the average global ocean conditions had already crossed into the uncertainty range of the ocean acidification boundary. This analysis was further extended to the subsurface ocean, revealing that up to 60% of the global subsurface ocean (down to 200 m) had crossed that boundary, compared to over 40% of the global surface ocean. These changes result in significant declines in suitable habitats for important calcifying species, including 43% reduction in habitat for tropical and subtropical coral reefs, up to 61% for polar pteropods, and 13% for coastal bivalves. By including these additional considerations, we suggest a revised boundary of 10% reduction from pre-industrial conditions more adequately prevents risk to marine ecosystems and their services; a benchmark which was surpassed by year 2000 across the entire surface ocean.
Increased oceanic uptake of CO 2 due to rising anthropogenic emissions has caused lowered pH levels (ocean acidification) that are hypothesized to diminish biotic calcification and reduce the export of total alkalinity ( A T ) as carbonate minerals from the surface ocean or their burial in coastal sediments. This “CO 2 ‐biotic calcification feedback” is a negative feedback on atmospheric CO 2 , as elevated levels of surface A T increase the ocean's capacity to uptake CO 2 . We detect signatures of this feedback in the global ocean for the first time using repeat hydrographic measurements and seawater property prediction algorithms. Over the course of the past 30 years, we find an increase in global surface A T of 0.072 ± 0.023 μmol kg −1 yr −1 , which would have caused approximately 20 Tmol of additional A T to accumulate in the surface ocean. This finding suggests that anthropogenic CO 2 emissions are measurably perturbing the cycling of carbon on a planetary scale by disrupting biological patterns. More observations of A T would be required to understand the effects of this feedback on a regional basis and to fully characterize its potential to reduce the efficiency of marine carbon dioxide removal technology.
Accurate assessment of anthropogenic carbon dioxide (CO2) emissions and their redistribution among the atmosphere, ocean, and terrestrial biosphere in a changing climate is critical to better understand the global carbon cycle, support the development of climate policies, and project future climate change. Here we describe and synthesize datasets and methodologies to quantify the five major components of the global carbon budget and their uncertainties. Fossil CO2 emissions (EFOS) are based on energy statistics and cement production data, while emissions from land-use change (ELUC) are based on land-use and land-use change data and bookkeeping models. Atmospheric CO2 concentration is measured directly, and its growth rate (GATM) is computed from the annual changes in concentration. The global net uptake of CO2 by the ocean (SOCEAN, called the ocean sink) is estimated with global ocean biogeochemistry models and observation-based fCO2 products (fCO2 is the fugacity of CO2). The global net uptake of CO2 by the land (SLAND, called the land sink) is estimated with dynamic global vegetation models. Additional lines of evidence on land and ocean sinks are provided by atmospheric inversions, atmospheric oxygen measurements, and Earth system models. The sum of all sources and sinks results in the carbon budget imbalance (BIM), a measure of imperfect data and incomplete understanding of the contemporary carbon cycle. All uncertainties are reported as ±1σ. For the year 2023, EFOS increased by 1.3 % relative to 2022, with fossil emissions at 10.1 ± 0.5 GtC yr−1 (10.3 ± 0.5 GtC yr−1 when the cement carbonation sink is not included), and ELUC was 1.0 ± 0.7 GtC yr−1, for a total anthropogenic CO2 emission (including the cement carbonation sink) of 11.1 ± 0.9 GtC yr−1 (40.6 ± 3.2 GtCO2 yr−1). Also, for 2023, GATM was 5.9 ± 0.2 GtC yr−1 (2.79 ± 0.1 ppm yr−1; ppm denotes parts per million), SOCEAN was 2.9 ± 0.4 GtC yr−1, and SLAND was 2.3 ± 1.0 GtC yr−1, with a near-zero BIM (−0.02 GtC yr−1). The global atmospheric CO2 concentration averaged over 2023 reached 419.31 ± 0.1 ppm. Preliminary data for 2024 suggest an increase in EFOS relative to 2023 of +0.8 % (−0.2 % to 1.7 %) globally and an atmospheric CO2 concentration increase by 2.87 ppm, reaching 422.45 ppm, 52 % above the pre-industrial level (around 278 ppm in 1750). Overall, the mean of and trend in the components of the global carbon budget are consistently estimated over the period 1959–2023, with a near-zero overall budget imbalance, although discrepancies of up to around 1 GtC yr−1 persist for the representation of annual to semi-decadal variability in CO2 fluxes. Comparison of estimates from multiple approaches and observations shows the following: (1) a persistent large uncertainty in the estimate of land-use change emissions, (2) low agreement between the different methods on the magnitude of the land CO2 flux in the northern extra-tropics, and (3) a discrepancy between the different methods on the mean ocean sink. This living-data update documents changes in methods and datasets applied to this most recent global carbon budget as well as evolving community understanding of the global carbon cycle. The data presented in this work are available at https://doi.org/10.18160/GCP-2024 (Friedlingstein et al., 2024).
Below the aragonite saturation horizon (ASH), the aragonitic skeletons of deep‐sea reef building corals are more susceptible to dissolution. Ocean acidification is causing the ASH to shallow worldwide, threatening the health and future of deep‐sea coral reefs. Deep‐sea reefs in the North Pacific already exist at or below the ASH, making them particularly vulnerable to future ocean acidification. Here we analyze multiple years (2014–2019) of seawater chemistry data from the Hawaiian‐Emperor Seamount Chain (HESC), focusing particularly on intermediate depths (300–800 m) where deep‐sea reefs have been found. Intermediate water masses were identified across the HESC based on characteristic temperature, salinity, and density ranges. We then characterize the corresponding carbonate chemistry of each water mass. North Pacific Intermediate Water (NPIW) dominates at intermediate depths for most of our sites. However, the influence of Pacific Subpolar Intermediate Water (PSIW) increases north of 29°N. PSIW has a shallower ASH and lower oxygen conditions than NPIW. The increasing influence of PSIW may thus play a role in restricting reef development, partially explaining why deep‐sea reefs have not been found on seamounts north of Koko (34.8°N) in this region. In addition, topographic induced upwelling and temporal variability (seasonal, annual) have the potential to shift the ASH by >100 m depth. As ocean acidification progresses, chronic exposure to corrosive waters may negatively affect reef development and persistence. Characterizing the current carbonate chemistry conditions and variability is critical for informed decision making and management efforts to preserve these valuable ecosystems under future climate change.
Hydrographic data from cruises of the Investigaciones Mexicanas de la Corriente de California (IMECOCAL) program since 1998 were used to assess the chemical conditions associated with carbon variables in the water column in the transect “Line 100.” Seasonal climatologies along the IMECOCAL line highlight the upwelling season, during which water with different chemical characteristics is transported to the surface. Additionally, interannual events influenced the amplitude and timing of wind‐driven coastal upwelling and the region's relative volumes of dominant water mass. Seasonal climatologies of pH, calcium carbonate saturation states, and dissolved inorganic carbon (DIC) concentration were estimated from hydrographic proxy variables. The strength of seasonal upwelling was reflected in the depth of the aragonite saturation horizon (ASH), which was variable nearshore: 90 m (±29 m) in spring and 133 m (±32 m) in winter. Offshore (>50 km), the effect of upwelling diminished, and the ASH was deeper and less variable (spring: 152 m ± 25 m; winter: 151 m ± 28 m). However, aragonite saturation values <1 were found at depths >250 m and were associated with Equatorial Subsurface Water (ESsW) dominance. At seasonal timescales, Subarctic Water (SAW) was found to modulate ASH depth. At interannual scales, ASH was found to be deeper (180 m) during periods of El Niño and shallower (120 m) during La Niña conditions. However, the impacts of El Niño and La Niña events give notable differences in the ASH depth.
Along with other carbon monitoring groups, the ocean acidification (OA) community has been observing, modeling, and projecting the impacts of changing carbonate chemistry for over two decades. The Global Ocean Acidification Observing Network (GOA-ON) has three key goals related to these issues: (1) improve understanding of global OA conditions, (2) improve understanding of ecosystem responses to OA, and (3) acquire and exchange data necessary to optimize modeling for OA and its impacts. GOA-ON and associated networks have a wealth of knowledge, data, models, and best practice guides on how to monitor global carbonate chemistry, and GOA-ON regional hubs collaborate at local scales to inform policy and action for coastal communities. Here, the GOA-ON community shares lessons learned relevant for marine carbon dioxide removal (mCDR) research and development. Understanding whether, how, and where mCDR approaches should be deployed will require knowledge of the carbonate system, robust observations, sensor technology, and modeling capacities. Ongoing monitoring, reporting, and verification during field trials and any eventual implementation of mCDR will again require these resources. The GOA-ON community's knowledge about environmental impacts, running laboratory and field experiments, and deriving biological indicators of change is of fundamental importance for assessing the environmental impacts of mCDR and of the potential for mitigating or exacerbating OA. Finally, we present recommendations for utilizing this OA experience toward mCDR research.
Ocean Alkalinity Enhancement (OAE) is increasingly considered as a marine carbon dioxide removal (mCDR) strategy with the potential cobenefit of mitigating ocean acidification (OA), but this remains poorly constrained. Here, we evaluate these biological cobenefits for 27 marine calcifiers whose calcification has declined under OA, by quantifying both historical OA-driven calcification losses and the potential of OAE to reverse them under scenarios with and without air-sea equilibration. Regression models describing calcification as a function of TA-DIC reveal substantial declines since preindustrial times, particularly in linear responders (mean 22%, range 7-44%), such as gastropods and pteropods, while threshold responders show minimal decline (∼3%). A realistic addition of 50 μmol kg-1 of OAE alkalinity restores species-specific calcification rates maximally only between 0 and 52.2%, with the largest benefits in OA-sensitive taxa. However, restoring preindustrial calcification requires far larger TA additions (mean 104 ± 58 μmol kg-1 without equilibration and more than triple this amount when equilibration with atmospheric CO2 is considered). While higher CDR efficiency enhances atmospheric CO2 drawdown, it simultaneously reduces the potential for biological OA mitigation. Thus, restoration of marine calcifiers through the OAE will not necessarily align with its climate goals, complicating its application in ocean management and CDR policy.
 Richard (Rik) Wanninkhof合作论文数NOAA's Atlantic Oceanographic and Meteorological Laboratory, U.S. Department of Commerce175
 Christopher Sabine合作论文数Department of Oceanography, School of Ocean & Earth Science & Technology, University of Hawai`i at Manoa123
 Simone R. Alin合作论文数Oceanography, University of Washington94Carter Brendan R合作论文数62
 Burke Hales合作论文数College of Earth, Ocean, and Atmospheric Sciences, Oregon State University;Dakunalytics, LLC.56
 Frank J. Millero合作论文数Division of Marine and Atmospheric Chemistry, University of Miami53Gary J. Massoth合作论文数53
 Bronte Tilbrook合作论文数Antarctic Climate and Ecosystems Cooperative Research Centre;Commonwealth Scientific and Industrial Research Organisation52Edward T. Baker合作论文数48
 Nina Bednarsek合作论文数Southern Calif Coastal Water Res Project48Robert Key合作论文数Program in Atmospheric and Oceanic Sciences, Princeton University46
 Adrienne J. Sutton合作论文数Horn Point Laboratory, University of Maryland Center for Environmental Science46
 Andrew Dickson合作论文数Scripps Institution of Oceanography, University of California, San Diego45Jan A Newton合作论文数44
 Are Olsen合作论文数Geophysical Institute, University of Bergen44
 Nicolas Gruber合作论文数Department of Environmental Systems Science, ETH Zürich42
 Robert H. Byrne合作论文数Department of Chemical Oceanography, College of Marine Science, University of South Florida42
 Scott Doney合作论文数Scott Doney Computational Biogeochemistry Lab, Department of Environmental Sciences, University of Virginia37
 Siv K. Lauvset合作论文数37
 Masao Ishii (石井雅男)合作论文数Department of Climate and Geochemistry Research, Meteorological Research Institute37Dana Greeley合作论文数36
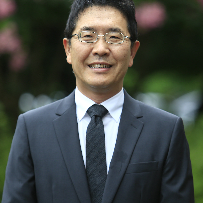 Kitack Lee合作论文数Pohang University of Science and Technology35
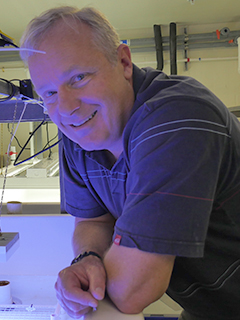 Chris Langdon合作论文数Department of Marine Biology and Ecology, Rosenstiel School of Marine and Atmospheric Science, University of Miami34
 Taro Takahashi合作论文数Lamont-Doherty Earth Observatory, Columbia Climate School, Columbia University34
 Nicolas Metzl合作论文数33Jeremy T. Mathis合作论文数School of Fisheries and Ocean Sciences, University of Alaska Fairbanks32
 Wiley Evans合作论文数College of Oceanic and Atmospheric Sciences, Oregon State University31
 Gregory C. Johnson合作论文数Ocean Climate Research Division, Pacific Marine Environmental Laboratory, National Oceanic and Atmospheric Administration;School of Oceanography, University of Washington30Akihiko Murata合作论文数29
 Dorothee C. E. Bakker合作论文数Centre for Ocean and Atmospheric Sciences, School of Environmental Sciences, Faculty of Science, University of East Anglia29
 Jan Marinus Hoppema合作论文数Helmholtz Centre for Polar and Marine Research, Alfred Wegener Institute;Department Physical Oceanography of Polar Seas, Alfred Wegener Institute;University of Applied Sciences Bremerhaven28Marilyn F. Lamb合作论文数27
 Denis Pierrot合作论文数Rosenstiel School of Marine and Atmospheric Science, University of Miami27
 Colm Sweeney合作论文数Global Monitoring Laboratory, National Oceanic and Atmospheric Administration, Earth System Research Laboratories26Leticia Barbero合作论文数Laboratoire d'Océanographie et du Climat: Expérimentations et approches numériques, UPMC25
 Francisco P. Chavez合作论文数Monterey Bay Aquarium Research Institute24
 Toste Tanhua合作论文数24John L Bullister合作论文数24
 Marta Álvarez合作论文数Centro Oceanográfico de A Coruña, Instituto Español de Oceanografia24
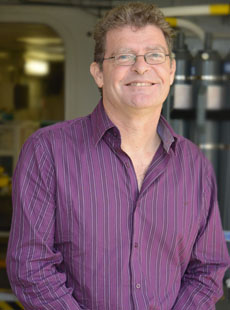 Nicholas R. Bates (Nicholas Bates)合作论文数National Oceanography Centre Southampton, University of Southampton;Bermuda Institute of Ocean Sciences23
 Lynne D. Talley合作论文数Scripps Institution of Oceanography, University of California, San Diego23A. Kozyr合作论文数22Alex Kozyr合作论文数22Catherine E. Cosca合作论文数22Samantha A. Siedlecki合作论文数22
 Laurie W Juranek合作论文数School of Oceanography, University of Washington22
 Peter Landschutzer合作论文数Max Planck Inst Meteorol, Hamburg, Germany21
 Tsuneo Ono合作论文数21




