Supplementary Figure 1. Forest plot of prevalence of breast cancer screening among cancer survivors. The estimated prevalence of breast cancer screening for each study is presented numerically and graphically, with point estimates shown as boxes scaled by study weight and whiskers representing the 95% confidence intervals (CIs). The overall pooled prevalence, calculated using a random-effects model, is represented by a diamond, with its width corresponding to the 95% CI.
Supplementary Figure 4. Pooled prevalence of breast cancer screening by study design. The pooled prevalence estimates of breast cancer screening, calculated using random-effects models, are displayed as diamonds with whiskers indicating 95% confidence intervals (CIs). Estimates were pooled separately by study design (cross-sectional vs. case-control vs. cohort), using the chi-square statistic to test for differences in pooled estimates across subgroups (p=0.344).
Supplementary Figure 12. Funnel plot of odds ratio for breast cancer screening among cancer survivors compared to the cancer-free general population. The outer dashed lines indicate the triangular region within which 95% of studies are expected to lie in the absence of bias. The solid black line corresponds to the summary effect estimate. Black dots correspond to studies included in this analysis.
Background and Aims:Colonoscopy is an effective screening tool, but it is resource-intensive and carries procedural risks. We aimed to develop and validate a biomarker-based risk prediction model (RPM) to improve triage of average-risk patients for colonoscopy by better predicting high-risk adenomas (HRAs). Methods:We assessed blood-based biomarkers of glucose metabolism, liver enzymes, lipids, ferritin, and carcinoembryonic antigen (CEA) in 980 average-risk individuals undergoing screening colonoscopy. Logistic regression was used to predict HRAs, defined as adenomas ≥10 mm, villous histology, high-grade dysplasia, or ≥3 adenomas. Biomarkers were modeled as continuous variables; variable selection was performed using logistic regression and least absolute shrinkage and selection operator. Model performance was evaluated with area under the curve, reclassification indices, calibration statistics, bootstrap validation, and decision curve analysis. Results:Glucose and CEA were significantly associated with HRAs, while no biomarkers were linked to high-risk sessile serrated lesions. Nine RPMs were developed; 3 were selected for validation. A model including all univariately associated biomarkers (CEA, C-peptide, gamma-glutamyl transferase, glucose, hemoglobin A1c, triglycerides) achieved an optimism-adjusted area under the curve of 0.66 (95% confidence interval, 0.60-0.71). Reclassification indices showed that adding biomarkers improved stratification, with the all-biomarkers model yielding the highest net reclassification improvement. Conclusion:Biomarker-enhanced RPMs modestly improved prediction of HRAs compared with models using only clinical and demographic variables. These findings support the potential of biomarkers to optimize colonoscopy resource allocation, but additional markers and refinement are needed to establish clinical utility.
Supplementary Table 3. Study quality assessment for both study aims. Table 3A displays the study quality for each study included in Aim 1, while Table 3B (case-control studies) and Table 3C (cross-sectional studies) display the study quality for each study in Aim 2.
Supplementary Figure 3. Pooled prevalence of breast cancer screening by screening method. The pooled prevalence estimates of breast cancer screening, calculated using random-effects models, are displayed as diamonds with whiskers indicating 95% confidence intervals (CIs). Estimates were pooled separately by method of screening, categorized as mammography only, mammography plus other screening method, or other non-mammography screening method only (including clinical breast examination, magnetic resonance imaging, or breast sonography). The chi-square statistic was used to test for differences in pooled estimates across subgroups (p=0.450).
Supplementary Figure 5. Pooled prevalence of breast cancer screening by study quality. The pooled prevalence estimates of breast cancer screening, calculated using random-effects models, are displayed as diamonds with whiskers indicating 95% confidence intervals (CIs). Estimates were pooled separately based on study quality (low, moderate or high, assessed using revised version of the tool proposed by Hoy et al. (33)). The chi-square statistic was used to test for differences in pooled estimates across subgroups (p=0.509).
Supplementary Figure 19. Pooled odds ratio of breast cancer screening comparing cancer survivors to the cancer-free general population, stratified by period of assessment. The odds ratio (OR) reported in each study is presented numerically and graphically, with point estimates shown as boxes scaled by study weight and whiskers representing the 95% confidence intervals (CIs). Estimates were pooled separately according to whether studies assessed screening starting prior to or after 2010. The chi-square statistic was used to test for differences in pooled estimates across subgroups (p=0.620). Pooled ORs, calculated using a random-effects model, are represented by diamonds with their width corresponding to the 95% CI.
Background:Increasing incidence rates of colorectal cancer (CRC) diagnosed before age 50 have been reported in Canada and other Western countries. Several organizations have lowered their recommended starting age for CRC screening. We aimed to analyze CRC rates in Canada and model the impacts of lowering the age to start faecal immunochemical test (FIT)-based screening in Canada. Methods:We evaluated the differences in absolute and relative incidence rates between age groups over time using the Canadian Cancer Registry data. Additionally, we used the OncoSim-Colorectal microsimulation model to examine starting FIT screening at 45 years of age over a lifetime time horizon. We estimated changes in CRC cases, deaths, potential years of life gained, and costs. Results:Absolute CRC incidence increased among groups below 50 years of age, with recent birth cohorts experiencing the greatest relative increases. Microsimulation results suggest that screening at 45 would result in fewer CRC cases (15 070) and CRC deaths (6100) in Canada between 2025 and 2071. For every additional 100 colonoscopies, 3.5 fewer CRC cases and 1.4 fewer CRC deaths are expected. Modelling suggests this may lead to an overall cost savings of $233 million CAD over the lifespan of eligible cohorts. Conclusion:Our results indicate that as CRC incidence in younger age groups has continued to increase, lowering the age to start FIT screening to 45 would result in overall population benefit through reduced CRC incidence and mortality. However, given resource considerations, provincial decision makers must evaluate changes in their programs to ensure proper implementation.
Supplementary Figure 11. Forest plot of the odds ratio for breast cancer screening, comparing cancer survivors to the cancer-free general population. The odds ratio (OR) reported in each study is presented numerically and graphically, with point estimates shown as boxes scaled by study weight and whiskers representing the 95% confidence intervals (CIs). The overall pooled OR, calculated using a random-effects model, is represented by a diamond, with its width corresponding to the 95% CI.
Supplementary Figure 14. Sensitivity analysis for meta-analysis of the odds ratio for breast cancer screening excluding studies examining breast cancer screening other than screening mammography. The odds ratio (OR) comparing cancer survivors to the cancer-free general population reported in each study is presented numerically and graphically, with point estimates shown as boxes scaled by study weight and whiskers representing the 95% confidence intervals (CIs). The overall pooled OR, calculated using a random-effects model, is represented by a diamond, with its width corresponding to the 95% CI. Studies which assessed screening methods other than mammography were excluded.
Background: Endoscopic retrograde cholangiopancreatography (ERCP) is associated with a high risk of adverse events (AEs) and unplanned hospital encounters (UHEs) but the impact of pre-existing depression and/or anxiety is unknown. We aimed to examine this association. Methods: We analyzed multi-centre prospective data on adults undergoing ERCP to examine associations between pre-existing anxiety and/or depression and post-ERCP UHEs (any emergency department visit or unplanned admission) within 30 days, separately for reasons related to AEs and for reasons not meeting criteria AEs. We conducted multivariable logistic regressions to examine associations including relevant covariates. Results: The cohort included 6648 patients, with 11.8% having pre-existing depression and/or anxiety. The group with depression and/or anxiety was significantly younger, had higher rates of opioid and cannabis use, and had a greater proportion of females. There were no statistically significant differences in non-AE-related UHEs in patients with and without depression/anxiety (5.0% vs 4.1%, respectively, p = 0.26), or AEs (7.4% vs 7.7%, respectively, p = 0.75). There was no association between depression/anxiety and non-AE UHEs on multivariable modelling (adjusted odds ratio, OR, 1.27, 95% CI 0.86-1.89), including on sub-analysis of UHEs to somatic symptoms only (OR 0.85, 95% CI 0.47-1.53). Similarly, no association was found between depression/anxiety and AEs (OR 0.85, 95% CI 0.61-1.17). Conclusions: We found no statistically significant associations between pre-existing depression and/or anxiety and ERCP outcomes. Further research is needed investigate diagnostic classes and symptom severity along with other factors that could impact outcomes.
Supplementary Figure 7. Pooled prevalence of breast cancer screening by time between cancer diagnosis and screening assessment. The pooled prevalence estimates of breast cancer screening, calculated using random-effects models, are displayed as diamonds with whiskers indicating 95% confidence intervals (CIs). Estimates were pooled separately based on time from cancer diagnosis to screening assessment, categorized as studies with mean/median time since diagnosis ≥5 years, <5 years, or including cancer survivors irrespective of and not reporting on time since diagnosis (i.e., ever diagnosed).The chi-square statistic was used to test for differences in pooled estimates across subgroups (p=0.206).
Supplementary Figure 2. Pooled prevalence of breast cancer screening by age eligibility and screening definition. The pooled prevalence estimates of breast cancer screening, calculated using random-effects models, are displayed as diamonds with whiskers indicating 95% confidence intervals (CIs). Estimates were pooled separately by study population (screening-eligible age only [≥40 years] vs. inclusion of non-eligible ages) and by screening definition (screened within a specified time period vs. ever screened) and the chi-square statistic used to test for differences in pooled estimates across subgroups (p=0.565).
Supplementary Figure 17. Pooled odds ratio of breast cancer screening comparing cancer survivors to the cancer-free general population, stratified by study quality. The odds ratio (OR) reported in each study is presented numerically and graphically, with point estimates shown as boxes scaled by study weight and whiskers representing the 95% confidence intervals (CIs). Estimates were pooled separately based on study quality (assessed as low, moderate or high). The chi-square statistic was used to test for differences in pooled estimates across subgroups (p=0.557). Pooled ORs, calculated using a random-effects model, are represented by diamonds with their width corresponding to the 95% CI.
Supplementary Figure 13. Sensitivity analysis for meta-analysis of the odds ratio for breast cancer screening comparing cancer survivors to the cancer-free general population excluding studies recruiting ever-screened and age-ineligible participants. The odds ratio (OR) comparing cancer survivors to the cancer-free general population reported in each study is presented numerically and graphically, with point estimates shown as boxes scaled by study weight and whiskers representing the 95% confidence intervals (CIs). The overall pooled OR calculated using a random-effects model, is represented by a diamond, with its width corresponding to the 95% CI. Studies which included age-ineligible participants (<40 years old), or which defined screening participation as ever being screened were excluded.
Supplementary Table 2. Number of studies by the method of screening ascertainment according to primary cancer sites for breast cancer screening prevalence
Supplementary Figure 21. Pooled odds ratio of breast cancer screening comparing cancer survivors to the cancer-free general population, stratified by primary cancer site. The odds ratio (OR) reported in each study is presented numerically and graphically, with point estimates shown as boxes scaled by study weight and whiskers representing the 95% confidence intervals (CIs). The OR among studies including survivors of mixed cancer sites (A), colorectal (B), blood (C), cervical (D), and uterine cancer (E) were pooled separately, with site-specific pooled estimates (represented by a diamond) presented in each panel.
Cancer survivors are at increased risk of developing subsequent primary cancers, yet participation in recommended cancer screening remains suboptimal. Greater understanding of factors impacting screening participation is needed to inform strategies for improving uptake. Therefore, we aimed to review and quantitatively synthesize predictors of participation in breast cancer (BC) and colorectal cancer (CRC) screening among cancer survivors. MEDLINE (Ovid), EMBASE, PubMed, and CINAHL databases were searched from inception through September 2024 to identify studies examining predictors of CRC or BC screening among survivors of other adult cancers. Random effect models were used to estimate pooled associations for predictors reported in ≥ 3 studies. From 2492 initial citations, 49 studies were included, with 35 studies reporting on CRC and 29 on BC screening participation. Factors significantly associated with CRC screening included having a healthcare provider, having health insurance, receiving a provider recommendation for screening, a greater number of physician visits, older age, being a nonsmoker, being married, higher income or education, urban residence, and better mental health. Factors associated with BC screening included receiving a written follow-up care plan, a greater number of physician visits, being married, not having dual Medicaid-Medicare coverage status, receiving specialist care, and White racial identity. Healthcare access and survivorship care factors appear to play an important role in screening participation among cancer survivors. Interventions addressing barriers to care and social determinants of health may help improve screening uptake and reduce disparities in subsequent cancer screening in this high-risk population.
 Brenner Darren R合作论文数77
 Steven J. Heitman合作论文数Department of Medicine, University of Calgary;Cumming School of Medicine, University of Calgary;Peter Lougheed Centre71
 Yibing Ruan合作论文数Department of Population Health Research, Alberta Health Services56
 Dylan E O'Sullivan合作论文数Department of Oncology, University of Calgary;Department of Community Health Sciences, University of Calgary;Oncology Outcomes Initiative, University of Calgary;University of Calgary, University of Calgary49
 Nauzer Forbes合作论文数Department of Community Health Sciences, University of Calgary42
 Alaa Rostom合作论文数36S Elizabeth McGregor合作论文数35
 Marja J. Verhoef合作论文数University of Calgary30
 Catherine Dube合作论文数28Marcus Vaska合作论文数27
 Linda Rabeneck合作论文数Dalla Lana School of Public Health, University of Toronto24
 Gil Kaplan合作论文数Department of Medicine, Cumming School of Medicine, University of Calgary;Department of Community Health Sciences, Cumming School of Medicine, University of Calgary;Alberta Health Services;The Calvin, Phoebe and Joan Snyder Institute for Chronic Diseases17
 Alan Barkun合作论文数Division of Gastroenterology & Hepatology, Faculty of Medicine and Health Sciences, McGill University;Department of Medicine, McGill University;McGill University Health Centre16Ronald Bridges合作论文数15Lr Sutherland合作论文数14
 Braden Manns合作论文数O'Brien Institute for Public Health, University of Calgary13Devon J. Boyne合作论文数Department of Oncology, University of Calgary;Department of Community Health Sciences, University of Calgary;Oncology Outcomes Initiative, University of Calgary11
 Lawrence Paszat合作论文数Odette Cancer Centre, Sunnybrook Health Sciences Centre;Department of Radiation Oncology, University of Toronto;Institute for Clinical Evaluative Sciences11
 Jill Tinmouth合作论文数Institute for Health Policy, Management and Evaluation, University of Toronto;Department of Medicine, Temerty Faculty of Medicine, University of Toronto;Institute for Clinical Evaluative Sciences;Sunnybrook Research Institute;Ontario Health11Daniel von Renteln合作论文数10Courtney Maxwell合作论文数10Ian L. Epstein合作论文数10Paul James合作论文数Department of Medicine, Temerty Faculty of Medicine, University of Toronto10
 Winson Cheung合作论文数Department of Oncology, Cumming School of Medicine, University of Calgary;Arnie Charbonneau Cancer Institute, University of Calgary10
 Mark Gordon Swain合作论文数Department of Medicine, Cumming School of Medicine, University of Calgary;The Calvin, Phoebe and Joan Snyder Institute for Chronic Diseases, The University of Calgary;Division of Gastroenterology and Hepatology, The University of Calgary10
 Paul L. Beck合作论文数Center for Study of Inflammatory Bowel Disease, Massachusetts General Hospital10
 Jennifer Telford合作论文数Division of Gastroenterology, Department of Medicine, Faculty of Medicine, The University of British Columbia10Richard Sultanian合作论文数10
 Harminder Singh合作论文数Department of Internal Medicine, Max Rady College of Medicine, University of Manitoba10
 Myriam Martel合作论文数McGill University Health Centre;Institut de Recherche, Centre Universitaire de Santé McGill10
 Susanna Town合作论文数9Pierre Hallé合作论文数9Michael Sey合作论文数9
 Remo Panaccione合作论文数Department of Medicine, Cumming School of Medicine, University of Calgary9Refik Saskin合作论文数Institute for Clinical Evaluative Sciences, Toronto, Ontario, Canada9
 Kirles Bishay合作论文数Department of Medicine, University of Calgary8
 Maida Sewitch合作论文数Division of Gastroenterology & Hepatology, Faculty of Medicine and Health Sciences, McGill University8
 Rajesh N Keswani合作论文数Gastroenterology and Hepatology, Department of Medicine, Feinberg School of Medicine, Northwestern University8Sutherland L R合作论文数8Joseph Romagnuolo合作论文数8
 Jon Meddings合作论文数Calgary Division of Gastroenterology & Hepatology, Faculty of Medicine, University of Calgary;Foothills Medical Centre8Anthony R. Maclean合作论文数8Rachid Mohamed合作论文数8SE MCGREGOR合作论文数7R Liam Sutherland合作论文数Department of Oncology, University of Calgary7
 Brendan C Lethebe合作论文数Department of Community Health Sciences, Cumming School of Medicine, University of Calgary, Calgary, Alberta, Canada.7
 Nancy Baxter合作论文数School of Population and Global Health, University of Melbourne7
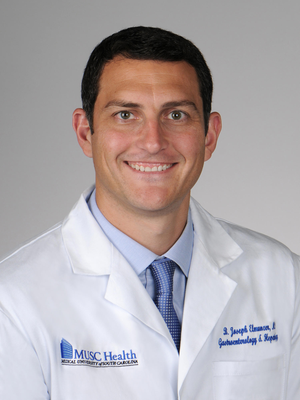 Badih Joseph Elmunzer合作论文数College of Medicine, Medical University of South Carolina7
 Kelly W Burak合作论文数Health Sciences Center, University of Calgary7




