The Landsat program provides the longest continuous global record of thermal infrared observations of the Earth's surface, underpinning critical applications in climate monitoring, water resources, ecosystem dynamics, urban heat analysis, and natural hazard assessment. The release of a global inventory of Landsat Collection 2 Level 2 surface temperature products by the U.S. Geological Survey (USGS) marked a major milestone in operational provision of Landsat thermal infrared analysis-ready data. Ongoing validations and community uses of Collection 2 have identified opportunities to further improve accuracy, uncertainty characterization, and emissivity correction across diverse atmospheric and surface conditions. In preparation for the planned Landsat Collection 3 reprocessing of the Landsat data record in the late 2020s, the USGS is implementing a coordinated set of enhancements to the Level 2 surface temperature products. These include revised emissivity estimation that leverages external datasets, improved atmospheric characterization and uncertainty propagation, expanded dynamic range for high temperature targets, consideration of split window atmospheric correction algorithm for Landsat 8 and 9, and decoupling of thermal infrared processing from visible to shortwave infrared constraints to enable surface temperature retrievals under low or no solar illumination conditions. These changes are designed to improve product quality and consistency across the Landsat record. Beyond near-term performance gains, the Collection 3 design establishes a scalable processing architecture to accommodate the expanded spectral and radiometric measurement capabilities of the forthcoming Landsat 10 mission. By preserving continuity across the Landsat 4–9 record while enabling future algorithm evolution, Landsat Collection 3 will provide a foundation for long-term, multi-decadal Earth system thermal infrared observations.
This paper explores gaps, opportunities and future technology needs for satellite Earth Observation (EO) to address wildland fire science and applications for the next Decadal Survey time-period focusing on: 1) pre-fire fuels, 2) active fire monitoring, 3) smoke and aerosol observation, and 4) post-fire recovery. This paper stems from a workshop of over 40 experts in wildland fire science and applications. We find that advancing wildland fire science and applications for the 2027 – 2037 Decadal Survey time-period and beyond, will require more dynamic, integrated, and interoperable EO systems. There is a need to move beyond static and abstracted variables, towards validated, precise and meaningful measurements. High accuracy thermal, imaging spectroscopy, LiDAR, SAR, and (shortwave) optical and spectrometer observations—combined with coordinated field campaigns for validation and calibration—will enable the retrieval of detailed, physically meaningful measurements of fire behavior and impacts. Meeting these needs also demands integrated and interoperable EO architectures that provide concurrent measurements of fuels, weather, and active fire conditions of combustion processes and energetic distribution, leverage AI/ML for low-latency onboard processing and adhere to standardized data sharing principles. These advances will allow next-generation fire prediction models to ingest dynamic EO inputs toward process-level simulation of fire behavior and smoke modeling, and support near-real-time operational forecasting and tactical responses. As the EO landscape becomes more diverse and with the increase of fire frequency and intensity, new dedicated collaboration paradigms cross-cutting Earth system spheres (atmosphere, hydrosphere, biosphere, cryosphere, geosphere) and integrating public, private, and nonprofit sectors will be essential to deliver comprehensive wildland fire observations required for future resilience.
Livestock farming is the dominant source of atmospheric ammonia (NH3) in large parts of the world. However, its emissions remain difficult to quantify because of the complex and diverse nature of farms, and the technical and practical challenges involved in measuring NH3. Emission estimates from individual farms are traditionally obtained from in situ measurements, while regional to global distributions are provided by infrared satellite sounders. Airborne hyperspectral infrared imaging can be used to map NH3 over large areas (>10km2) and at high spatial resolution (<5m), therefore providing measurements at a scale between in situ and satellite data.During a joint ESA-NASA funded campaign in the summer of 2023 near Grosseto, Italy, a cattle farm and its surroundings were overflown by a research aircraft 69 times in five days. Airborne hyperspectral longwave infrared imagery was collected using the NASA-JPL Hyperspectral Thermal Emission Spectrometer (HyTES). We developed an efficient lookup table approach to derive NH3 abundances and associated uncertainties from the HyTES radiance data. The resulting distributions reveal a diversity of small and large NH3 plumes emanating from the farm. Lagoons and barns were identified as the main emission hotspots. From these distributions and with the help of a box model, total farm fluxes were estimated for each overflight. The emission fluxes range from 3±1 to 7±5ghd−1h−1 for the first three days, in line with emission factors reported by other studies. Much larger emissions are seen on the last two days, between 13±8 and 59±42ghd−1h−1, likely caused by specific farm activities. Overall, this case study demonstrates that airborne hyperspectral infrared imaging is a valuable complement to existing methods for quantifying NH3 emissions at the farm scale.
The hyperspectral thermal emission spectrometer (HyTES) is an airborne sensor measuring surface-leaving thermal infrared (TIR) radiation with 256 bands in the 7.5-12-mu m spectral range. During its 2023 deployment over the Swiss Alps, as part of a large European campaign, instrument-related cross-track radiometric biases were identified. We present a correction methodology tailored to Glaciers. The method exploits physically constrained radiance over melting ice to derive wavelength- and pixel-specific correction factors. Developed on one flightline and applied on all six HyTES flightlines, the correction successfully reduced cross-track inconsistencies and striping artifacts. Validation with in situ data results in a mean absolute deviation (MAD) of 1.75 K, which improved by 5.3 K compared to the uncorrected data. Although developed on the cryosphere, the method is transferable to other surfaces with homogeneous, known temperature and well-characterized emissivity for the entire cross-track. The corrected dataset provides unprecedented opportunities for Glacier studies.
Monitoring and mapping geothermal activity from airborne and satellite platforms is challenging due to extensive vegetation cover. This study explores the ways to use vegetation and its spectral, thermal, and phenological signatures to track underlying geothermal activity. We explored and developed a series of prediction models for predicting foliar antimony concentration at Waiotapu Geothermal Field in New Zealand using a combination of hyperspectral, thermal, and SAR datasets from high spatial resolution airborne- (e.g., AisaFENIX, thermal, and LiDAR) and coarse resolution satellite platforms (e.g., EMIT, ECOSTRESS and Sentinel-1). Our results indicate that geothermal fields and the extent of the geothermal activity can be successfully mapped using their vegetation cover. This approach can open new uses of Earth observation data to monitor geothermal activity from space.
We stand at the threshold of a transformative era in Earth observation, marked by space‐borne visible‐to‐shortwave infrared (VSWIR) imaging spectrometers that promise consistent global observations of ecosystem function, phenology, and inter‐ and intra‐annual change. However, the full value of repeat spectroscopy, the information embedded within different temporal scales, and the reliability of existing algorithms across diverse ecosystem types and vegetation phenophases have remained elusive due to the absence of suitable sub‐seasonal spectroscopy data. In response, the Surface Biology and Geology (SBG) High‐Frequency Time Series (SHIFT) campaign was initiated during late February 2022 in Santa Barbara County, California. SHIFT, designed to support NASA's SBG mission, addressed mission scoping, scientific advancement, applications development, and community building. This ambitious endeavor included weekly Airborne Visible InfraRed Imaging Spectrometer‐Next Generation (AVIRIS‐NG) imagery acquisitions for 13 weeks (spanning February 24 to May 29, 2022), accompanied by coordinated terrestrial vegetation and coastal aquatic data collection. We describe the rich datasets collected and illustrate how the complex sub‐seasonal patterns of change can be linked to biological science and applications, surpassing insights from multispectral observations. Leveraging open‐source processing methods and cloud‐based analysis tools, the SHIFT campaign showcases the readiness of the scientific community to harness ecological insights from remotely sensed hyperspectral time series. We provide an overview of SHIFT's goals, data collections, preliminary results, and the collaborative efforts of early career scientists committed to unlocking the transformative potential of high‐frequency time series data from space‐borne VSWIR imaging spectrometers.
The ECOsystem Spaceborne Thermal Radiometer Experiment on Space Station (ECOSTRESS) mission, launched to the International Space Station on June 29, 2018, currently provides high spatial resolution thermal observations in five bands with a revisit time of 1-5 days. The ECO2LSTE product, which provides the land surface temperature (LST) and emissivity (LSE) retrieved using the temperature and emissivity separation (TES) algorithm, serves as an essential ECOSTRESS product for generating the other higher-level products such as evapotranspiration and water use efficiency. Considering the radiometric calibration issues identified in the ECOSTRESS Collection 1 (C1) radiance data, recently the Collection 2 (C2) products have been released to address the cold bias in LST estimates below 300 K. Additionally, following the restoration of the two bands centered at 8.29 and 9.20 mu m, the ECOSTRESS TES algorithm was shifted from 3-band to 5-band after May 2023. Consequently, a comprehensive evaluation is necessary to have a better understanding how LST&E estimates from different collections and algorithms perform. In this study, the impact of radiometric recalibration on LST&E estimates was first investigated for both the 3-band and 5-band TES algorithms based on a representative simulation dataset. Subsequently, we evaluated the accuracy of ECOSTRESS LST&E estimates in both collections using globally distributed ground measurements, and a spatial comparison between the C1 and C2 LST estimates was conducted over three selected regions to investigate their discrepancies of temperature spatial distribution. The simulation analysis revealed that the C2 LST was marginally lower than the C1 LST above 320 K but became higher below 320 K, with significant overestimation observed below 270 K. For LSE, the C2 estimates were generally lower than those in C1, particularly in the first three bands. Compared to the 3-band TES, larger differences between the C1 and C2 LST&E estimates were found for the 5-band TES. Based on the site-scale evaluation of LST, the cold bias between 270 and 300 K was effectively corrected in C2, with the bias in this range significantly reduced from approximately-2 K to 0. However, an overestimation exceeding 2 K was found for the C2 LST below 270 K, which may be caused by the overcorrection at low temperatures. LST estimates from both collections performed similarly above 300 K, with a systematically overestimation about 1 K. The spatial evaluation of LST reaffirms the findings from the simulation analysis and site-scale evaluation regarding the differences between C1 and C2 LST estimates. In the site-scale evaluation of LSE, a minor improvement was achieved in C2 over non-gray bodies, but the accuracy decreased over gray bodies. The LSE estimates using the 3band and 5-band TES algorithms were comparable. Overall, this study provides updated information on the accuracies and differences of ECOSTRESS LST&E estimates from both collections, promoting the informed use of ECO2LSTE products in various downstream research applications with a clearer understanding of their performance.
Post-launch calibration and validation over the lifetime of missions is needed to ensure that any long-term variation in an observation, e.g. an area getting hotter, can be unambiguously assigned to a change in the Earth system, rather than a change in calibration. Such activities enable measurements from different satellites to be inter-compared and used seamlessly to create long-term multi-instrument/multi-platform data records, which serve as the basis for large-scale international science investigations into topics with high societal or environmental importance. In order to help address this need we have established a set of automated validation sites where the necessary measurements for validating mid and thermal infrared data from spaceborne and airborne sensors are made every few minutes on a continuous basis. We have also conducted multi-agency airborne campaigns with thermal infrared sensors to develop precursor datasets for future NASA and ESA missions to acquire mid and thermal infrared data as well as characterize variability within the automated validation sties. We have established automated validation sites at several locations including Lake Tahoe CA/NV, Salton Sea CA and La Crau, France. The Lake Tahoe site was established in 1999, the Salton Sea site was established in 2008 and the La Crau site was established in 2023. Each site has one or more custom-built highly accurate (50mK) radiometers measuring the surface skin temperature. All the measurements are made every few minutes and downloaded hourly via a cellular modem. Data from the sites have been used to validate numerous satellite instruments including the Advanced Very High Resolution Radiometer (AVHRR) series, the Along Track Scanning Radiometer (ATSR) series, the Advanced Spaceborne Thermal Emission and Reflectance Radiometer (ASTER), the Landsat series, the Moderate Resolution Imaging Spectroradiometer (MODIS) on both the Terra and Aqua platforms, the Visible Infrared Imaging Radiometer Suite (VIIRS) and the ECOsystem Spaceborne Thermal Radiometer Experiment on Space Station (ECOSTRESS). In all cases the standard products have been validated including the standard radiance at sensor, radiance at surface, surface temperature and surface emissivity products. Over the last several years NASA and ESA have conducted multiple joint airborne campaigns to obtain data at high spatial and spectral resolutions to simulate future satellite sensors as well as characterize potential validation sites, such as the La Crau validation site. These data are currently being used to simulate the ASI/NASA Surface Biology and Geology (SBG) thermal infrared (TIR) mission, the ESA Land Surface Temperature Monitoring (LSTM) mission and the ISRO/CNES Thermal infraRed Imaging Satellite for High-resolution Natural resource Assessment (TRISHNA) mission. We will present results from the validation of the mid and thermal infrared data using the automated validation sites as well as results from the recent airborne campaigns.
Mapping and managing Earth's mineral resources demands advanced techniques for characterizing surface composition, a challenge that can be effectively addressed by spaceborne Earth observation. Thermal Infrared (TIR) sensors hosted on orbital platforms provide a powerful tool for regional scale (similar to 1000 s.km(2)), high-resolution (<= 100 m) identification of mineral composition and surface thermal properties. In this study, we demonstrate the potential of multispectral TIR image data acquired by the ECOsystem Spaceborne Thermal Radiometer Experiment on Space Station (ECOSTRESS) and Advanced Spaceborne Thermal Emission and Reflection Radiometer (ASTER) spaceborne sensors with near-global coverage to produce the first mineral maps of the Earth's arid and semi-arid regions. TIR data complement Visible to ShortWave Infrared (VSWIR) data because the most important rock-forming minerals do not have features in the VSWIR. Thus, integrating TIR-derived mineralogy is essential to comprehensively map the surface composition and interpret the geology. The mapping results were validated at three sites-the Algodones Dunes (quartz), White Sands Dunes (gypsum), and Mehdi Ridge (calcite)-showing strong spatial and abundance agreement with laboratory data from field samples and reference literature. These results confirm the reliability of high spatial resolution multispectral TIR data in capturing major surface mineral distributions.
ECOsystem Spaceborne Thermal Radiometer Experiment on Space Station (ECOSTRESS) has been providing high spatio-temporal thermal infrared (TIR) observations (~70 m, 1-5 days) since August 2018. Land surface temperature (LST) retrieval obtained from TIR observations indicates the thermal status of the surface as a consequence of the land-atmosphere exchange of energy and water. It carries the imprint of vegetation water use and stress, thus serving as a pivotal lower boundary condition for retrieving evapotranspiration (ET). Taking advantage of the ECOSTRESS observations, the European ECOSTRESS Hub (EEH) funded by the European Space Agency (ESA) retrieves high-resolution ET for terrestrial ecosystems. In EEH Phase 1 (2020-2022), instantaneous ET data between 2018 and 2021 were generated from three models with different structures and parameterization schemes over Europe and Africa, including the Surface Energy Balance System (SEBS) and Two Source Energy Balance (TSEB) parametric models, as well as the analytical Surface Temperature Initiated Closure (STIC) model. The evaluation by comparing against ground measurements at 19 eddy covariance sites for 6 different biomes over Europe showed that the physically based STIC model had relatively better consistency and higher accuracy across varying aridity and diverse biomes. Also, an advantage of STIC was found as compared to the official ECOSTRESS ET product obtained using the PT-JPL model, especially over arid and semiarid regions due to the weak LST control in PT-JPL. Taking advantage of the recalibrated ECOSTRESS Collection 2 data, EEH Phase 2 (2023-2025) analyses the impacts of LST estimates from different algorithms on ET retrieval and related biophysical conductances over different biomes. It is found that ET estimates of STIC driven by LST retrieved from the two most commonly used algorithms (i.e., split window, SW, and temperature and emissivity separation, TES) have comparable accuracies. The sensitivity of ET to LST over savannas is almost three times of those over biomes over lower aridity. Surface-canopy conductance is more sensitive to surface temperature as compared to aerodynamic conductance. Overall, the EEH is promising to provide quality assured ET estimates for monitoring terrestrial ecosystem water use and stress. Furthermore, it will facilitate the preparation for the next generation high-resolution thermal missions by investigating surface energy balance modeling, including TRISHNA (CNES/ISRO), SBG (NASA), and LSTM (ESA).
The Hyperspectral Thermal Emission Spectrometer (HyTES) offers high spatial and spectral resolution thermal infrared (TIR) airborne measurements, which are crucial for deriving land surface temperature and emissivity (LST&E). These measurements have wide-ranging applications, particularly in understanding water stress and plant water use. One critical application of TIR satellite-sensor systems is the estimation of evapotranspiration (ET), which can be derived from LST. ET is essential for modeling water fluxes from the land surface, and various algorithms leverage LST as a key boundary condition for this purpose. In this study, we apply an ET algorithm to HyTES LST data for the first time, using an analytical surface energy balance model, the Surface Temperature Initiated Closure (STIC) version 1.3. We provide an overview of the STIC model, detailing its application to HyTES data, including the integration of ancillary datasets. We demonstrate the practicality of this approach by presenting ET and LST calculations for HyTES flightlines from three field campaigns conducted in 2019, 2021, and 2023. To validate our results, we compare the derived ET and LST against available in situ measurements, including eddy covariance-derived latent heat flux and radiometer-derived LST. While this study focuses on HyTES data, the same methodology is applicable to any instantaneous LST dataset. Advancing TIR mapping of ET is crucial for applications in agriculture, water management and for understanding the evolving water cycle.
In this analysis of the spatial resolving power of thermal imagery products we focus on four satellite instruments that are used in research and applications, for example, to monitor land surface temperature and derive evapotranspiration. These are thermal imagers on Landsat 7, Landsat 8, and Landsat 9, as well as the ECOsystem Spaceborne Thermal Radiometer Experiment on Space Station (ECOSTRESS). We compiled sets of close-in-time, day-time images of bridges surrounded by open water bodies, captured by each of the satellite imagers during cloud-free moments. Where possible, we also included some images captured by the Compact Thermal Imager (CTI), a technology demonstrator that was co-located with ECOSTRESS on the International Space Station in 2019. Bridges were found to provide a sufficient thermal contrast with the water surface to quantify the line-spread function of satellite-based thermal products. The full-width-at-half-max of a gaussian beam model fitted to this transect quantifies the on-orbit spatial resolution of different imagers. The results show some loss of spatial resolving power in the final product delivered to end-users as compared to the at-sensor characterization of spatial resolution. For Landsat 7, 8, and 9, the spatial resolution of the thermal bands is 1.5 times the ground sampling distance of 60 and 100 m respectively. For the ECOSTRESS the difference is up to twice the sampling distance of 78 by 69 m2. Since spatial resolution is a main driver for instrument design it is important to understand and communicate this discrepancy between pre-flight design parameters and the characteristics of the surface imagery delivered to the user community. The goal of this research is to facilitate an improved fusion of current and future satellite observations into harmonized products with superior temporal and spatial characteristics. This manuscript describes a method to verify the spatial resolution of thermal imagers after launch. Spatial resolution is a key driving requirement in thermal imager design and technology development. Many aspects that control spatial resolution are mathematically understood and can be calculated based on the design specifications of spaceborne imagers. However, the actual spatial resolution of the products delivered to users may not meet the design target precisely. In this paper we compiled a set of thermal images of the San Francisco Bay area. In these daytime images the bridges show up as clearly defined linear features contrasted with the relatively homogenous water surrounding them. From these images, we construct sharply defined profiles perpendicular to the bridge orientation. We then use these profiles as analogs of the linear cuts used to determine the line-spread function in laboratory tests of imagers. What we find is a much lower spatial resolving power in the final product delivered to end-users as compared to the at-sensor characterization of spatial resolution. The reduced spatial resolution we found compared to what may be expected from mission specifications points to the need of better communication of how imager specifications are conveyed into mission products. Day-time thermal contrast between a bridge and its surrounding waters is used to quantify the spatial performance of space-borne imagers Spatial resolution of thermal imagery products can be lower, to a factor of 2, than the nominal values calculated based on system design The divergence between pre-flight and on-orbit metrics should be factored into mission design trade studies
In this work, comparison results between data collected on the ground and by the Hyperspectral Thermal Emission Spectrometer (HyTES) acquired during the 2023 European airborne campaign are showed. NASA-Jet Propulsion Laboratory (JPL), European Space Agency (ESA), Italian Space Agency (ASI), National Centre for Space Studies (CNES), and various European universities and national research institutes collaboratively organized the campaign. Multiple test areas were designated in Italy, France, and Switzerland, with flights conducted from late May to midJuly. Here, we show the Italian volcanic areas, were specifically targeted for the HyTES flights. By this work, the authors aim to give an overview about the Italian Calibration and Validation (Cal/Val) sites, classified as thermally active sites, and to present preliminary results obtained in such area. The sites can be defined "thermally active" due to the presence of thermal anomalies at the surface related to volcanic activity ranging from 60 degrees C to 1000 degrees C. In addition, the same test sites have been selected in the THERESA (THErmal infRarEd SBG Algorithms) project, aimed to enhance algorithms for processing Thermal InfraRed data from the Surface Biology and Geology (SBG) - Thermal InfraRed ( TIR) mission. During the lifetime of the project, THERESA will contribute to enhance the investigation of terrestrial phenomena by using both visible and thermal images.
One of the Designated Observables (DOs) identified in the Decadal Survey for Earth SFcience and Applications from Space was Surface Biology and Geology (SBG). NASA has formulated this and several of the other DOs into the Earth System Observatory, which provides a framework from which to answer many of the questions posed by the Decadal Survey and address the goals of the DOs. The SBG mission concept, now in formulation, has an overarching goal of acquiring global hyperspectral visible to shortwave infrared (VSWIR; 0.38-2.5 mu m) and multispectral mid and thermal infrared (MIR: 3-5 mu m; TIR: 8-12 mu m) image data at high spatial resolution (similar to 30 m in the VSWIR and similar to 60 m in the TIR). The VSWIR and TIR are separate instruments on separate platforms and thus will have different characteristics such as local overpass and temporal revisit times as a function of the individual scientific objectives. The SBG-TIR is a joint-endeavor between NASA and ASI in Italy, with the instrument being built at the NASA Jet Propulsion Laboratory (JPL). It will have a wide swath width (935 km) resulting in a three-day equatorial revisit time. During Phase A development, the TIR spectral resolution was increased from five to six bands (plus the original two planned for the MIR). The addition of a 10.3 mu m band vastly improves the capability of surface mineralogy mapping and aerosol detection in sulfur dioxide (SO2) plumes. For the first time, an Earth-orbiting TIR mission is planning an operational surface mineralogy (SM) L3 product. This product uses the L2 TIR surface emissivity data as input together with a spectral library of the most common Earth surface minerals to produce mineral and weight percent silica (WPS) maps of the Earth's arid lands. Here, we describe the current SM algorithm testing and development, initial results, and plans for ongoing work prior to the planned 2028 launch.
This work aims to characterize the surface of an Italian geothermal field, Parco Naturalistico delle Biancane (PNB), by using hyperspectral data and define the main diagnostic spectral features of lithotypes affected by mineral alteration due to geothermal activity. Hyperspectral data acquired by PRISMA (Hyperspectral Precursor of the Application Mission) and AVIRIS-NG (Airborne Visible / Infrared Imaging Spectrometer – Next Generation), coupled with a spectral library of the main lithotype of the area, represent the dataset used for the analysis. All the spectral data cover the VNIR (Visible and Near InfraRed) and SWIR (Short-Wave InfraRed) spectral range. The Material Identification and Characterization Algorithm (MICA) has been used to perform the comparison between the spectral features from the spectral library and the PRISMA and AVIRIS hyperspectral images in order to obtain an automatic lithotype classification map.
High spatial resolution global land surface emissivity datasets are valuable for various applications. The Advanced Spaceborne Thermal Emission and Reflection Radiometer (ASTER) Global Emissivity Dataset (GED) is the only accessible global emissivity data with a high spatial resolution (∼100 m). Since the launch of the ECOsystem Spaceborne Thermal Radiometer Experiment on Space Station (ECOSTRESS) in June 2018, another high spatial resolution GED can be generated. A comprehensive comparison is needed to investigate the consistency between the ASTER and ECOSTRESS GEDs before subsequent applications and the release of the ECOSTRESS GED. We conducted a first-ever comparison between the ASTER and ECOSTRESS GEDs in two ways: 1) global spatial comparison and 2) validation using emissivity measurements at 9 sand dune and 2 vegetated sites. The results reveal that the ECOSTRESS emissivities in bands 2 and 4 are in good agreement with ASTER GED, with mean absolute biases (MAB) of ∼ 1 % averaged over the globe. The emissivity difference is the largest for snow and ice in these two bands. For band 5, the discrepancy is relatively larger with a MAB of 1.7 %. The largest emissivity difference is found over evergreen broadleaf forests in humid regions. Comparison with measurements reveals an average root-mean-square error (RMSE) of ECOSTRESS emissivity of ∼ 3 % among all the nine sand sites for all the 3 bands. At the two vegetated sites, the average RMSE is ∼ 1.5 %. The absolute biases are below 3 % in all the bands. The average RMSE between ASTER and ECOSTRESS GEDs among all sand dune sites is 1.29 %. The evaluation results demonstrate a good agreement between these two emissivity retrievals overall and high accuracy of the ECOSTRESS GED.
The ECOsystem Spaceborne Thermal Radiometer Experiment on Space Station (ECOSTRESS) is a scientific mission that collects high spatio‐temporal resolution (∼70 m, 1–5 days average revisit time) thermal images since its launch on 29 June 2018. As a predecessor of future missions, one of the main objectives of ECOSTRESS is to retrieve and understand the spatio‐temporal variations in terrestrial evapotranspiration (ET) and its responses to soil water availability and atmospheric aridity. In the European ECOSTRESS Hub (EEH), by taking advantage of land surface temperature (LST) retrievals, we generated ECOSTRESS ET products over Europe and Africa using three models with different structures and parameterization schemes, namely Surface Energy Balance System (SEBS) and Two Source Energy Balance (TSEB) parametric models, as well as the non‐parametric Surface Temperature Initiated Closure (STIC) model. A comprehensive evaluation of the EEH ET products was conducted with respect to flux measurements from 19 eddy covariance sites in Europe over six different biomes with diverse aridity levels. Results revealed comparable performances of STIC and SEBS (RMSE of ∼70 W m −2 ). However, the relatively complex TSEB model produced a higher RMSE of ∼90 W m −2 . Comparison between STIC ET estimates and the operational ECOSTRESS ET product from NASA PT‐JPL model showed a larger RMSE (around 50 W m −2 higher) for the PT‐JPL ET estimates. Substantial overestimation (>80 W m −2 ) in PT‐JPL ET estimates was evident over shrublands and savannas, presumably due to weak constraint of LST in the model. Overall, the EEH supports ET retrieval for the future high‐resolution thermal missions.
Satellite observations in the Thermal Infra-Red (TIR) domain provide valuable information on Land Surface Temperatures, Evapo-Transpiration and water use efficiency and are useful for monitoring vegetation health, agricultural practices and urban planning. By 2030, there will be 3 new high-resolution global coverage satellite TIR missions in space, all of them with fields of view larger than ± 30°. Directional anisotropy in TIR can affect the estimation of key application variables, such as temperature, and are typically studied by means of field campaigns or physical modelling. In this work, we have evaluated directional effects using simultaneous measurements from Landsat-8 and the ± 45°field of view MASTER airborne TIR sensor from NASA. Differences as high as 6 K are observed in the surface temperatures derived from these simultaneous observations. Those differences are attributed to directional effects, with the greatest differences associated with hotspot conditions, where the solar and satellite viewing directions align. Five well studied parametric directional models have then been fitted to the temperature differences, allowing the amplitude of the measured directional effects to be reduced below 1 K, with small variations between models. These results suggest that a simple correction for directional effects could be implemented as part of the ground segment processing for the upcoming missions.
 Glynn C. Hulley合作论文数Jet Prop Lab, CALTECH104
 William R. Johnson合作论文数Plastic & Hand Surgery Associates, PLLC32
 Kerry Cawse-Nicholson合作论文数32
 S. Geoffrey Schladow合作论文数Department of Civil and Environmental Engineering, University of California29
 Robert O. Green合作论文数Jet Propulsion Laboratory, California Institute of Technology18
 Joshua Fisher合作论文数Schmid College of Science and Technology, Chapman University17
 Chris Hain合作论文数Short-term Prediction Research and Transition Center, NASA Marshall Space Flight Center17
 Philipp Schneider合作论文数Norwegian Inst Air Res NILU16
 Sander Veraverbeke合作论文数California Institute of Technology, Ghent University16
 Bjorn T. Eng合作论文数16
 Julia A. Barsi合作论文数Landsat Project Science Office, Science Systems and Applications, Inc.16
 Giles Marion合作论文数The Desert Research Institute15
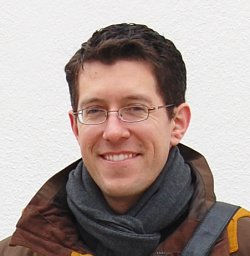 Bradley James Thomson合作论文数Johns Hopkins University Applied Physics Laboratory15
 Alice Baldridge合作论文数Jet Propulsion Laboratory, California Institute of Technology15
 Martha Anderson合作论文数Hydrology and Remote Sensing Laboratory, Agricultural Research Service, U. S. Department of Agriculture15
 Carlos Roberto De Souza Filho合作论文数Department of Geology and Natural Resources, Instituto de Geociências, State University of Campinas14
 Nathan Bridges合作论文数Applied Physics Laboratory, Johns Hopkins University;Department of Earth and Planetary Sciences, Johns Hopkins University14
 J. D. Lenters合作论文数14
 Gerardo Rivera合作论文数13
 Christine Lee合作论文数UCLA Civil and Environmental Engineering13Eva E. Borbas合作论文数Cooperative Institute for Meteorological Satellite Studies, University of Wisconsin-Madison13
 Brian L. Markham合作论文数Biospheric Sciences Laboratory, Goddard Space Flight Center, National Aeronautics and Space Administration13
 Nathan C. Healey合作论文数12
 John R. Schott合作论文数Digital Imaging and Remote Sensing Laboratory|Chester F. Carlson Center for Imaging Science|Rochester Institute of Technology12
 R. Greg Vaughan合作论文数11
 Pierre Guillevic合作论文数11Nina G. Raqueno合作论文数11
 Jim Crowley合作论文数Department of Geoscience, Boise State University10
 Michael J. Abrams合作论文数Jet Propulsion Laboratory, California Institute of Technology10
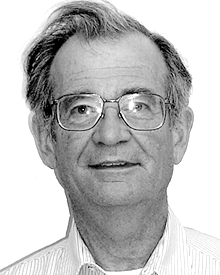 Frank D. Palluconi合作论文数10
 Gregory Halverson合作论文数CALTECH, Jet Prop Lab, 4800 Oak Grove Dr, Pasadena, CA 91109 USA9
 David Schimel合作论文数Jet Propulsion Laboratory, California Institute of Technology;Colorado State University9
 Kurtis John Thome合作论文数Goddard Space Flight Center, National Aeronautics and Space Administration9Anne B. Kahle合作论文数9
 Charles Miller合作论文数Jet Propulsion Laboratory, California Institute of Technology;Division of Geological and Planetary Sciences, California Institute of Technology9
 Dar Roberts合作论文数Department of Geography, Bren School of Environmental Science & Management, University of California, Santa Barbara9
 Jeffrey S. Kargel合作论文数University of Arizona8
 Nabin K. Malakar合作论文数8Turner Woody合作论文数8
 David R. Thompson合作论文数Jet Propulsion Laboratory, California Institute of Technology;Arizona State University8
 Richard Allen合作论文数Kimberly Research and Extension Center, University of Idaho;Department of Soil and Water Systems, College of Agricultural and Life Sciences, University of Idaho8
 Tsuneo Matsunaga合作论文数National Institute for Environmental Studies8
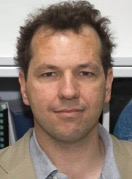 Martin J. Wooster合作论文数Department of Geography, King’s College London8Jeffrey C. Luvall合作论文数NASA, Marshall Space Flight Center8
 Elizabeth M. Middleton合作论文数Goddard Space Flight Center, National Aeronautics and Space Administration8
 Kaniska Mallick合作论文数Centre de Recherche Public – Gabriel Lippmann, Département Environnement et Agro-biotechnologies EVA, Belvaux, Luxembourg8
 Hideyuki Tonooka合作论文数8
 Philip Townsend合作论文数Department of Forest and Wildlife Ecology, College of Agricultural and Life Sciences, University of Wisconsin Madison8
 Robert O. Knuteson合作论文数Space Science and Engineering Center;University of Wisconsin-Madison;Space Science and Engineering Center, University of Wisconsin-Madison8




