Pervasive cirrus clouds in the upper troposphere and tropical tropopause layer (TTL) influence the climate by altering the top‐of‐atmosphere radiation balance and stratospheric water vapor budget. These cirrus are often associated with deep convection, which global climate models must parameterize and struggle to accurately simulate. By comparing high‐resolution global storm‐resolving models from the Dynamics of the Atmospheric general circulation Modeled On Non‐hydrostatic Domains (DYAMOND) intercomparison that explicitly simulate deep convection to satellite observations, we assess how well these models simulate deep convection, convectively generated cirrus, and deep convective injection of water into the TTL over representative tropical land and ocean regions. The DYAMOND models simulate deep convective precipitation, organization, and cloud structure fairly well over land and ocean regions, but with clear intermodel differences. All models produce frequent overshooting convection whose strongest updrafts humidify the TTL and are its main source of frozen water. Intermodel differences in cloud properties and convective injection exceed differences between land and ocean regions in each model. We argue that, with further improvements, global storm‐resolving models can better represent tropical cirrus and deep convection in present and future climates than coarser‐resolution climate models. To realize this potential, they must use available observations to perfect their ice microphysics and dynamical flow solvers.
Cirrus clouds of various thicknesses and radiative characteristics extend over much of the tropics, especially around deep convection. They are difficult to observe due to their high altitude and sometimes small optical depths. They are also difficult to simulate in conventional global climate models, which have coarse grid spacings and simplified parameterizations of deep convection and cirrus formation. We investigate the representation of tropical cirrus in global storm‐resolving models (GSRMs), which have higher spatial resolution and explicit convection and could more accurately represent cirrus cloud processes. This study uses GSRMs from the DYnamics of the Atmospheric general circulation Modeled On Non‐hydrostatic Domains (DYAMOND) project. The aggregate life cycle of tropical cirrus is analyzed using joint albedo and outgoing longwave radiation (OLR) histograms to assess the fidelity of models in capturing the observed cirrus cloud populations over representative tropical ocean and land regions. The proportions of optically thick deep convection, anvils, and cirrus vary across models and are portrayed in the vertical distribution of cloud cover and top‐of‐atmosphere radiative fluxes. Model differences in cirrus populations, likely driven by subgrid processes such as ice microphysics, dominate over regional differences between convectively active tropical land and ocean locations.
Starting in late 2013, the Northeast (NE) Pacific Ocean experienced anomalously warm sea surface temperatures (SSTs) that persisted for over 2 years. This marine heatwave, known as “the Blob,” produced many devastating ecological impacts with socioeconomic implications for coastal communities. The warm waters observed during the NE Pacific 2013/2016 marine heatwave altered the surface energy balance and disrupted ocean–atmosphere interactions in the region. In principle, ocean–atmosphere interactions following the formation of the marine heatwave could have perpetuated warm SSTs through a positive SST‐cloud feedback. The actual situation was more complicated. While reanalysis data show a decrease in boundary layer cloud fraction and an increase in downward shortwave radiative flux at the surface coincident with warm SSTs, this was accompanied by an increase in longwave radiative fluxes at the surface, as well as an increase in sensible and latent heat fluxes out of the ocean mixed layer. The result is a small negative net heat flux anomaly (compared to the anomalies of the individual terms contributing to the net heat flux). This provides new information about the midlatitude ocean–atmosphere system while it was in a perturbed state. More specifically, a mixed layer heat budget reveals that anomalies in both the atmospheric and oceanic processes offset each other such that the anomalously warm SSTs persisted for multiple years. The results show how the atmosphere–ocean system in the NE Pacific is able to maintain itself in an anomalous state for an extended period of time.
© 2018 American Meteorological Society. For information regarding reuse of this content and general copyright information, consult the AMS Copyright Policy (www.ametsoc.org/PUBSReuseLicenses).
Climate observations are needed to address a large range of important societal issues including sea level rise, droughts, floods, extreme heat events, food security, and freshwater availability in the coming decades. Past, targeted investments in specific climate questions have resulted in tremendous improvements in issues important to human health, security, and infrastructure. However, the current climate observing system was not planned in a comprehensive, focused manner required to adequately address the full range of climate needs. A potential approach to planning the observing system of the future is presented in this article. First, this article proposes that priority be given to the most critical needs as identified within the World Climate Research Program as Grand Challenges. These currently include seven important topics: melting ice and global consequences; clouds, circulation and climate sensitivity; carbon feedbacks in the climate system; understanding and predicting weather and climate extremes; water for the food baskets of the world; regional sea‐level change and coastal impacts; and near‐term climate prediction. For each Grand Challenge, observations are needed for long‐term monitoring, process studies and forecasting capabilities. Second, objective evaluations of proposed observing systems, including satellites, ground‐based and in situ observations as well as potentially new, unidentified observational approaches, can quantify the ability to address these climate priorities. And third, investments in effective climate observations will be economically important as they will offer a magnified return on investment that justifies a far greater development of observations to serve society's needs.
Aerosol-cloud radiative effects are determined and quantified in simulations of deep open-cell stratocumuli observed during the VAMOS Ocean-Cloud-Atmosphere-Land Study Regional Experiment (VOCALS-REx) campaign off the west coast of Chile. The cloud deck forms in a boundary layer 1.5 km deep, with cell sizes reaching 50 km in diameter. Global databases of ship tracks suggest that these linear structures are seldom found in boundary layers this deep. Here, we quantify the changes in cloud radiative properties to a continuous aerosol point source moving along a fixed emission line releasing 1017 particles per second. We show that a spatially coherent cloud perturbation is not evident along the emission line. Yet our model simulates an increase in domain-mean all-sky albedo of 0.05, corresponding to a diurnally averaged cloud radiative effect of 20 Wm(-2), given the annual mean solar insolation at the VOCALS-REx site. Therefore, marked changes in cloud radiative properties in precipitating deep open cells may be driven by anthropogenic near-surface aerosol perturbations, such as those generated by ships. Furthermore, we demonstrate that these changes in cloud radiative properties are masked by the naturally occurring variability within the organised cloud field. A clear detection and attribution of cloud radiative effects to a perturbation in aerosol concentrations becomes possible when sub-filtering of the cloud field is applied, using the spatio-temporal distribution of the aerosol perturbation. Therefore, this work has implications for the detection and attribution of effective cloud radiative forcing in marine stratocumuli, which constitutes one of the major physical uncertainties within the climate system. Our results suggest that ships may sometimes have a substantial radiative effect on marine clouds and albedo, even when ship tracks are not readily visible.
A 1-month subset from a global atmospheric simulation using the Super-Parameterized Community Atmosphere Model (SP-CAM), which implements the Multi-scale Modeling Framework (MMF) described in Khairoutdinov and Randall (2001) and Khairoutdinov et al. (2005). The version of the SP-CAM used here is described in Marchand et al. (2009) and Ovtchinnikov et al (2006), and was run at Pacific Northwest National Laboratory with DOE support. It is based on CAM 3.0 for the global atmospheric component, and uses the System for Atmospheric Modeling (SAM; Khairoutdinov and Randall 2003). This simulation is configured with CAM running the finite volume dynamical core on a 2x2.5 degree latitude-longitude grid with 26 vertical levels. The embedded CRM (SAM) is configured with 64 horizontal columns at 4 km grid spacing with 24 vertical levels (sharing the bottom 24 levels with the CAM grid), and single-moment microphysics. The simulation was initialized on 1 September 1997 and runs through June 2002, forced with observed monthly-mean sea surface temperatures. Only the month of July 2000 is uploaded here, which is what is required to reproduce the results in Hillman et al. (2018).
The polar amplification of warming and the ability of the Intertropical Convergence Zone (ITCZ) to shift to the north or south are two very important problems in climate science. Examining these behaviors in global climate models (GCMs) running solar geoengineering experiments is helpful not only for predicting the effects of solar geoengineering but also for understanding how these processes work under increased carbon dioxide (CO2). Both polar amplification and ITCZ shifts are closely related to the meridional transport of moist static energy (MSE) by the atmosphere. This study examines changes in MSE transport in 10 fully coupled GCMs in experiment G1 of the Geoengineering Model Intercomparison Project (GeoMIP), in which the solar constant is reduced to compensate for the radiative forcing from abruptly quadrupled CO(2 )concentrations. In G1, poleward MSE transport decreases relative to preindustrial conditions in all models, in contrast to the Coupled Model Intercomparison Project phase 5 (CMIP5) abrupt4xCO2 experiment, in which poleward MSE transport increases. We show that since poleward energy transport decreases rather than increases, and local feedbacks cannot change the sign of an initial temperature change, the residual polar amplification in the G1 experiment must be due to the net positive forcing in the polar regions and net negative forcing in the tropics, which arise from the different spatial patterns of the simultaneously imposed solar and CO(2 )forcings. However, the reduction in poleward energy transport likely plays a role in limiting the polar warming in G1. An attribution study with a moist energy balance model shows that cloud feedbacks are the largest source of uncertainty regarding changes in poleward energy transport in midlatitudes in G1, as well as for changes in cross-equatorial energy transport, which are anticorrelated with ITCZ shifts.
Satellite simulators are often used to account for limitations in satellite retrievals of cloud properties in comparisons between models and satellite observations. The purpose of this framework is to enable more robust evaluation of model cloud properties, so that differences between models and observations can more confidently be attributed to model errors. A critical step in this process is accounting for the difference between the spatial scales at which cloud properties are retrieved with those at which clouds are simulated in global models. In this study, we create a series of sensitivity tests using 4-km global model output from the multiscale modeling framework to evaluate the sensitivity of simulated satellite retrievals to common assumptions about cloud and precipitation overlap and condensate variability used in climate models whose grid spacing is many tens to hundreds of kilometers. We find the simulated retrievals are sensitive to these assumptions. Using maximum-random overlap with homogeneous cloud and precipitation condensate leads to errors in Multiangle Imaging Spectroradiometer and International Satellite Cloud Climatology Project-simulated cloud cover and in CloudSat-simulated radar reflectivity that are significant compared to typical differences between the model simulations and observations. A more realistic treatment of unresolved clouds and precipitation is shown to substantially reduce these errors. The sensitivity to these assumptions underscores the need for the adoption of more realistic subcolumn treatments in models and the need for consistency among subcolumn assumptions between models and simulators to ensure that simulator-diagnosed errors are consistent with the model formulation.
The amount of solar constant reduction required to offset the global warming from an increase in atmospheric CO2 concentration is an interesting question with implications for assessing the feasibility of solar geoengineering scenarios and for improving our theoretical understanding of Earth's climate response to greenhouse gas and solar forcings. This study investigates this question by analyzing the results of 11 coupled atmosphere–ocean global climate models running experiment G1 of the Geoengineering Model Intercomparison Project, in which CO2 concentrations are abruptly quadrupled and the solar constant is simultaneously reduced by an amount tuned to maintain the top-of-atmosphere energy balance and pre-industrial global mean temperature. The required solar constant reduction in G1 is between 3.2 % and 5.0 %, depending on the model, and is uncorrelated with the models' equilibrium climate sensitivity, while a formula from the experiment specifications based on the models' effective CO2 forcing and planetary albedo is well correlated with but consistently underpredicts the required solar reduction. We propose an explanation for the required solar reduction based on CO2 instantaneous forcing and the sum of radiative adjustments to the combined CO2 and solar forcings. We quantify these radiative adjustments in G1 using established methods and explore changes in atmospheric temperature, humidity, and cloud fraction in order to understand the causes of these radiative adjustments.The zonal mean temperature response in G1 exhibits cooling in the tropics and warming in high latitudes at the surface; greater cooling in the upper troposphere at all latitudes; and stratospheric cooling which is mainly due to the CO2 increase. Tropospheric specific humidity decreases due to the temperature decrease, while stratospheric humidity may increase or decrease depending on the model's temperature change in the tropical tropopause layer. Low cloud fraction decreases in all models in G1, an effect that is robust and widespread across ocean and vegetated land areas. We attribute this to a reduction in boundary layer inversion strength over the ocean, and a reduction in the release of water from plants due to the increased CO2. High cloud fraction increases in the global mean in most models. The low cloud fraction reduction and atmospheric temperature decrease have strong warming effects on the planet, due to reduced reflection of shortwave radiation and reduced emission of longwave radiation, respectively. About 50 % to 75 % of the temperature effect is caused by the stratospheric cooling, while the reduction in atmospheric humidity results in increased outgoing longwave radiation that roughly offsets the tropospheric temperature effect. The longwave (LW) effect of the cloud changes is small in the global mean, despite the increase in high cloud fraction. Taken together, the sum of the diagnosed radiative adjustments and the CO2 instantaneous forcing explains the required solar forcing in G1 to within about 6 %. The cloud fraction response to the G1 experiment raises interesting questions about cloud rapid adjustments and feedbacks under solar versus greenhouse forcings, which would be best explored in a model intercomparison framework with a solar-forcing-only experiment.
 Roger T. Marchand合作论文数Department of Atmospheric Sciences, University of Washington64
 Eugene E. Clothiaux合作论文数Department of Meteorology, The Pennsylvania State University, University Park42
 G. G. Mace合作论文数21James H Mather合作论文数18Kristinka Ivanova合作论文数Pennsylvania State University;University Park18Eugene E Clothiaux合作论文数16
 David J. Diner合作论文数16
 Charles N. Long合作论文数Pacific Northwest National Laboratory16Sally A. Mcfarlane合作论文数16
 John V. Martonchik合作论文数Jet Propulsion Laboratory, National Aeronautics and Space Administration;Jet Propulsion Laboratory, California Institute of Technology15
 Gerald “Jay” Mace合作论文数Department of Atmospheric Sciences, University of Utah15
 Ralph A Kahn合作论文数NASA Goddard Space Flight Center;The University of Colorado Boulder14
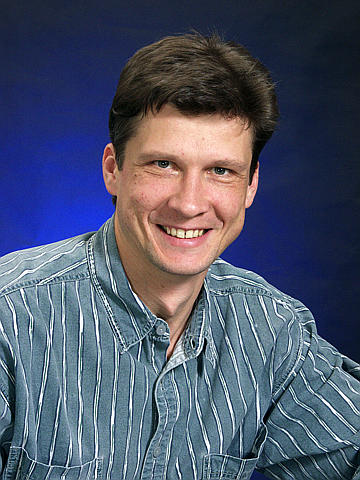 Mikhail Ovchinnikov合作论文数Pacific Northwest National Laboratory13
 Dave Turner合作论文数Global Systems Laboratory, National Oceanic and Atmospheric Administration13
 Laura M. Hinkelman合作论文数12
 Marcel Ausloos合作论文数School of Business, University of Leicester;Universitatea Babeș-Bolyai11
 Taneil Uttal合作论文数Environmental Technology Laboratory11
 Francisco P. J. Valero合作论文数Atmospheric Research Laboratory;Scripps Institute of Oceanography;Atmospheric Research Laboratory, Scripps Institute of Oceanography11
 James H. Mather合作论文数10Benjamin R. Hillman合作论文数9E. Kassianov合作论文数9
 Graeme Stephens合作论文数Center for Climate Sciences, Jet Propulsion Laboratory, California Institute of Technology9Fpj Valero合作论文数8
 Bruce A. Albrecht合作论文数Department of Atmospheric Sciences, Rosenstiel School of Marine, Atmospheric, and Earth Science, University of Miami8
 Andrew Heymsfield合作论文数Mesoscale and Microscale Meteorology Lab, National Center for Atmospheric Research, University Corporation for Atmospheric Research8
 Peter N. Blossey合作论文数Department of Atmospheric Sciences, College of The Environment, University of Washington8
 Qiang Fu (付强)合作论文数Department of Atmospheric Sciences, College of the Environment, University of Washington8
 Johannes Verlinde合作论文数Department of Meteorology, Pennsylvania State University8
 Robert Wood合作论文数Department of Atmospheric Sciences, University of Washington7Andreas Muhlbauer合作论文数Joint Institute for the Study of the Atmosphere and Ocean and Department of Atmospheric Sciences, University of Washington7Evgueni Kassianov合作论文数Pacific Northwest National Laboratory7
 Seiji Kato合作论文数7
 Roger Davies合作论文数Department of Physics, Faculty of Science, The University of Auckland7Jennifer M. Comstock合作论文数Pacific Northwest National Laboratory7
 Anthony B. Davis合作论文数Space and Remote Sensing Sciences Group;Los Alamos National Laboratory;Space and Remote Sensing Sciences Group, Los Alamos National Laboratory7
 Carol Bruegge合作论文数Jet Propulsion Laboratory, California Institute of Technology, NASA7MA Miller合作论文数6
 Phil Rasch合作论文数Atmospheric Sciences and Global Change Division, Pacific Northwest National Laboratory6
 Howard R. Gordon合作论文数Department of Physics, College of Arts and Sciences, University of Miami6
 Dale R. Durran合作论文数Department of Atmospheric Sciences, University of Washington;NVIDIA6Hampton N. Shirer合作论文数6
 Michel M. Verstraete合作论文数University of the Witwatersrand6
 Patrick Minnis合作论文数Analytical Mechanics Associates, Inc.6
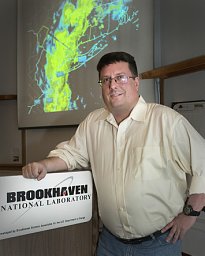 Michael Jensen合作论文数Brookhaven Natl Lab6James C. Barnard合作论文数6Brooks E. Martner合作论文数6
 Xiquan Dong合作论文数Department of Hydrology and Atmospheric Sciences, College of Science, The University of Arizona6
 Connor Flynn合作论文数6




