A recent report of the U.S. Climate Change Science Program (CCSP) identified a 'potentially serious inconsistency' between modelled and observed trends in tropical lapse rates (Karl et al., 2006). Early versions of Satellite and radiosonde datasets suggested that the tropical surface had warmed more than the troposphere, while climate models consistently showed tropospheric amplification of surface warming in response to human-caused increases in well-mixed greenhouse gases (GHGs). We revisit such comparisons here using new observational estimates of surface and tropospheric temperature changes. We find that there is no longer a serious discrepancy between modelled and observed trends in tropical lapse rates.This emerging reconciliation of models and observations has two primary explanations. First, because of changes in the treatment of buoy and satellite information, new surface temperature datasets yield slightly reduced tropical warming relative to earlier versions. Second, recently developed satellite and radiosonde datasets show larger warming of the tropical lower troposphere. In the case of a new satellite dataset from Remote Sensing Systems (RSS), enhanced warming is due to an improved procedure of adjusting for inter-satellite biases. When the RSS-derived tropospheric temperature trend is compared with four different observed estimates of surface temperature change, the surface warming is invariably amplified in the tropical troposphere, consistent with model results. Even if we use data from a second satellite dataset with smaller tropospheric warming than in RSS, observed tropical lapse rate trends are not significantly different from those in all other model simulations.Our results contradict a recent claim that all simulated temperature trends in the tropical troposphere and in tropical lapse rates are inconsistent with observations. This claim was based on use of older radiosonde and satellite datasets, and on two methodological errors: the neglect of observational trend uncertainties introduced by interannual climate variability, and application of an inappropriate statistical 'consistency test'. Copyright (c) 2008 Royal Meteorological Society
The U.S. economy has grown to be the world's largest, even in the face of the most varied and costly weather and climate extremes on the planet (see http://www.munichreamerica.com/webinars/2013_01_natcatreview/MunichRe_III_NatCat01032013.pdf). Nevertheless, these extremes continue to take a toll on the nation, diverting public and private funds while limiting economic growth and jobs and threatening the well‐being of Americans. Extreme weather events affect every state and manifest differently by region (see Figure 1 in Supporting Information in the online version of this Forum and http://www.ncdc.noaa.gov/billions/summary‐stats).
The spring and summer (March through August) of 2011–2012 set many new climatological records across the contiguous United States, including the hottest month in the instrumental record: July 2012. Various measures of temperature extremes and drought severity serve to put this period into historical perspective (1895 to present) and to assess to what extent the recent anomalies are consistent with observed trends. During spring and summer, anomalously high temperatures can combine with unusually dry conditions to amplify temperature and drought feedbacks. Observational data from 2011 and 2012 are strongly suggestive of such an amplification and reveal a number of significant trends for various measures of high temperatures in the United States.
We compare global-scale changes in satellite estimates of the temperature of the lower troposphere (TLT) with model simulations of forced and unforced TLT changes. While previous work has focused on a single period of record, we select analysis timescales ranging from 10 to 32 years, and then compare all possible observed TLT trends on each timescale with corresponding multi-model distributions of forced and unforced trends. We use observed estimates of the signal component of TLT changes and model estimates of climate noise to calculate timescale-dependent signal-to-noise ratios (S/N). These ratios are small (less than 1) on the 10-year timescale, increasing to more than 3.9 for 32-year trends. This large change in S/N is primarily due to a decrease in the amplitude of internally generated variability with increasing trend length. Because of the pronounced effect of interannual noise on decadal trends, a multi-model ensemble of anthropogenically-forced simulations displays many 10-year periods with little warming. A single decade of observational TLT data is therefore inadequate for identifying a slowly evolving anthropogenic warming signal. Our results show that temperature records of at least 17 years in length are required for identifying human effects on global-mean tropospheric temperature.
Severe weather conditions over the Southern Ocean create thick, well-mixed layers at the ocean surface that are a crucial pathway between the atmosphere and the deeper layers of the ocean. Anthropogenic carbon and heat are drawn down through these thick surface layers and exported in the deep seas for decades to centuries through the large-scale ocean circulation. Our ability to understand and ultimately predict climate is therefore dependent on the ability of climate models to correctly represent both the thick surface layers of the Southern Ocean and its large-scale circulation. In this study, we systematically evaluate the representation of the surface layer and Southern Ocean circulation in more than 20 climate models participating in the next IPCC assessment, and identifies the physical processes causing differences between the models. The models consistently produce surface layers that are too shallow …
The demand for long-term, sustained, reliable data and derived information on climate and its changes has never been greater than today. Long-term, well-calibrated, global observations of Essential Climate Variables (ECV) such as air temperature, precipitation, and sea-surface temperature are critical for defining the evolving state of the Earth's climate. Observing systems routinely collect much of the required data covering 49 ECVs, and significant progress has been made in coverage and technological capability over the two decades since the Second World Climate Conference. However, many key regions and climatic zones remain poorly observed, and gaps are widening in some cases. Supporting infrastructures for data stewardship and analysis are largely in place but require strengthening, while those for linking with socio-economic data and for providing user-oriented information services require more substantial development. The current capabilities are summarized, and further actions are identified to ensure that climate observation activities more fully meet the needs of science and society. The Global Climate Observing System (GCOS) was established in 1992 with the goal of providing comprehensive information on the total climate system, involving a multidisciplinary range of physical, chemical and biological observations of the atmosphere, oceans and land. GCOS is a "system of systems" that builds on the climate-relevant components of existing observing systems, and relies almost entirely upon national efforts to maintain and enhance those systems. Contributing systems include the World Meteorological Organization Global Observing System (GOS) for meteorology, its Global Atmosphere Watch (GAW) for atmospheric composition, the Global Ocean Observing System (GOOS), led by the United Nations Educational, Scientific and Cultural Organization (UNESCO) Intergovernmental Oceanographic Commission (IOC), and the Global Terrestrial Observing System (GTOS), led by the Food and Agriculture Organization of the United Nations (FAO). GCOS itself is the climate observing system within the Global Earth Observation System of Systems (GEOSS) developed under the auspices of the Group on Earth Observations (GEO). The established in situ networks and space-based components must be sustained and operated with ongoing attention to data quality in accordance with the GCOS Climate Monitoring Principles; enhancements must be made for some types of observations; the exchange of observations and delivery of data and information to users must be ensured; reprocessing and reanalysis must be strengthened; and national and international coordination must be improved. The consequence of not meeting these requirements would be to seriously compromise the information on, and predictions of, climate variability and change. Detailed information on GCOS and the datasets that are produced as a result of GCOS observing activities can be found at the Global Observing Systems Information Center (GOSIC) at http://gosic.org.
Contributing Authors: R. Adler (USA), L. Alexander (UK, Australia, Ireland), H. Alexandersson (Sweden), R. Allan (UK), M.P. Baldwin (USA), M. Beniston (Switzerland), D. Bromwich (USA), I. Camilloni (Argentina), C. Cassou (France), D.R. Cayan (USA), E.K.M. Chang (USA), J. Christy (USA), A. Dai (USA), C. Deser (USA), N. Dotzek (Germany), J. Fasullo (USA), R. Fogt (USA), C. Folland (UK), P. Forster (UK), M. Free (USA), C. Frei (Switzerland), B. Gleason (USA), J. Grieser (Germany), P. Groisman (USA, Russian Federation), S. Gulev (Russian Federation), J. Hurrell (USA), M. Ishii (Japan), S. Josey (UK), P. Kållberg (ECMWF), J. Kennedy (UK), G. Kiladis (USA), R. Kripalani (India), K. Kunkel (USA), C.-Y. Lam (China), J. Lanzante (USA), J. Lawrimore (USA), D. Levinson (USA), B. Liepert (USA), G. Marshall (UK), C. Mears (USA), P. Mote (USA), H. Nakamura (Japan), N. Nicholls (Australia), J. Norris (USA), T. Oki (Japan), F.R. Robertson (USA), K. Rosenlof (USA), F.H. Semazzi (USA), D. Shea (USA), J.M. Shepherd (USA), T.G. Shepherd (Canada), S. Sherwood (USA), P. Siegmund (Netherlands), I. Simmonds (Australia), A. Simmons (ECMWF, UK), C. Thorncroft (USA, UK), P. Thorne (UK), S. Uppala (ECMWF), R. Vose (USA), B. Wang (USA), S. Warren (USA), R. Washington (UK, South Africa), M. Wheeler (Australia), B. Wielicki (USA), T. Wong (USA), D. Wuertz (USA)
This paper analyzes the long-term (1901-2002) temporal trends in the agroclimate of Alberta, Canada, and explores the spatial variations of the agroclimatic resources and the potential crop-growing area in Alberta. Nine agroclimatic parameters are investigated: May-August precipitation (PCPN), the start of growing season (SGS), the end of the growing season (EGS), the length of the growing season (LGS), the date of the last spring frost (LSF), the date of the first fall frost (FEE), the length of the frost-free period (FFP), growing degree-days (GDDs), and corn heat units (CHUs). The temporal trends in the agroclimatic parameters are analyzed by using linear regression. The significance tests of the trends are made by using Kendall's tau method. The results support the following conclusions. 1) The Alberta PCPN has increased 14% from 1901 to 2002, and the increment is the largest in the north and the northwest of Alberta, then diminishes (or even becomes negative over two small areas) in central and southern Alberta, and finally becomes large again in the southeast corner of the province. 2) No significant long-term trends are found for the SGS, EGS, and LGS. 3) An earlier LSF, a later FEE, and a longer FFP are obvious all over the province. 4) The area with sufficient CHU for corn production, calculated according to the 1973-2002 normal, has extended to the north by about 200-300 km, when compared with the 1913-32 normal, and by about 50-100 km, when compared with the 1943-72 normal; this expansion implies that the potential exists to grow crops and raise livestock in more regions of Alberta than was possible in the past. The annual total precipitation follows a similar increasing trend to that of the May-August precipitation, and the percentile analysis of precipitation attributes the increase to low-intensity events. The changes of the agroclimatic parameters imply that Alberta agriculture has benefited from the last century's climate change.
 David R. Easterling合作论文数19
 Rw Knight合作论文数15
 Thomas C Peterson合作论文数National Climatic Data Center, National Oceanic and Atmospheric Administration14
 George Kukla合作论文数Lamont–Doherty Earth Observatory, Columbia University14
 Pavel Groisman合作论文数Institute of Oceanology, PP Shirshov Russian Academy of Sciences;Hydrology Science and Services Corp., HS&S;North Carolina Institute for Climate Studies, North Carolina State University12
 Stanley A. Changnon Jr.合作论文数Illinois State Water Survey11William E. Riebsame合作论文数9Robert G. Quayle合作论文数National Climatic Data Center;National Environmental Satellite and Data Information Service;National Oceanic and Atmospheric Administration8R. S. Vose合作论文数7N Plummer合作论文数6
 Kevin Trenberth合作论文数National Center for Atmospheric Research;Department of Physics, Faculty of Science, University of Auckland6J. Gavin合作论文数6P. M. STEURER合作论文数5R. L. SCHMOYER合作论文数5
 Jon Eischeid合作论文数Cooperative-Institute, NOAA Physical Sciences Laboratory5
 Philip Jones合作论文数Climatic Research Unit, School of Environmental Sciences, University of East Anglia5Richard W. Knight合作论文数5
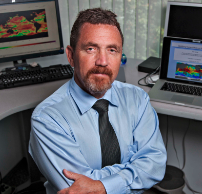 Benjamin David Santer (Benjamin D. Santer)合作论文数Lawrence Livermore National Laboratory, University of California5
 Frank Wentz合作论文数Microwave Climate Data Center, Remote Sensing Systems4
 Gerald Meehl合作论文数Climate and Global Dynamics Laboratory, National Center for Atmospheric Research4
 John R. Lanzante合作论文数Geophysical Fluid Dynamics Laboratory, Princeton University4
 Henry F. Diaz (Henry Diaz)合作论文数Department of Geography and Environment, College of Social Sciences, University of Hawaii-Manoa;Laboratory for Tree Ring Research, University of Arizona4
 Karl E. Taylor合作论文数Program for Climate Model Diagnosis and Intercomparison, Lawrence Livermore National Laboratory4
 Michael F. Wehner合作论文数Applied Mathematics and Computational Research Division, Lawrence Berkeley National Laboratory4
 Peter Thorne合作论文数National Oceanography Centre4Peter J. Gleckler合作论文数Program for Climate Model Diagnosis and Intercomparison;Livermore National Laboratory;Program for Climate Model Diagnosis and Intercomparison, Livermore National Laboratory4J Gavin合作论文数3Richard R. Heim合作论文数3
 T M L Wigley合作论文数School of Biological Sciences, University of Adelaide;National Center for Atmospheric Research3
 Kenneth Kunkel合作论文数Department of Marine, Earth and Atmospheric Sciences, NC State University3
 Aiguo Dai (戴爱国)合作论文数Department of Atmospheric and Environmental Sciences, University at Albany3
 Michael Schlesinger合作论文数Department of Atmospheric Sciences, School of Earth, Society, and Environment, College of Liberal Arts and Sciences, University of Illinois at Urbana-Champaign3
 Jeffrey L. Privette合作论文数NOAA National Climatic Data Center3
 Carl Mears合作论文数Remote Sensing Systems3Kevin Gallo合作论文数3Charles Doutriaux合作论文数Lawrence Livermore National Laboratory3John J. Bates合作论文数3Claude N. Williams合作论文数3Wei-Chyung Wang合作论文数Atmospheric Sciences Research Center, University at Albany, State University of New York, Albany, New York, United States3M Free合作论文数2JD TARPLEY合作论文数2
 Peter V. Caldwell合作论文数Ctr Integrated Forest Sci, USDA2
 Samuel Shen合作论文数Department of Mathematics and Statistics, San Diego State University2
 Bruce Baker合作论文数2
 Gavin A. Schmidt合作论文数Goddard Institute for Space Studies, National Aeronautics and Space Administration2
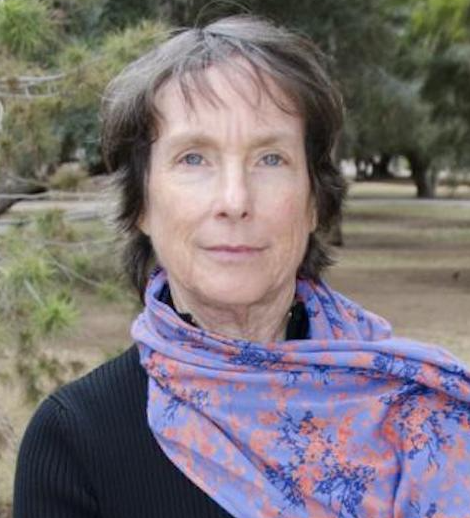 Connie Woodhouse合作论文数School of Geography and Development, The University of Arizona2
 Neville Nicholls合作论文数School of Earth Atmosphere and Environment, Monash University2
 Stephen A Klein合作论文数Cloud Processes Research Group, Lawrence Livermore National Laboratory2Albert J. Koscielny合作论文数2




