Multi-spacecraft observations of solar energetic particle (SEP) events not only enable a deeper understanding and development of particle acceleration and transport theories but also provide important constraints for model validation efforts. However, because of computational limitations, a given physics-based SEP model is usually best suited to capture a particular phase of an SEP event, rather than its whole development from onset through decay. For example, magnetohydrodynamic (MHD) models of the heliosphere often incorporate solar transients only at the outer boundary of their so-called coronal domain – usually set at a heliocentric distance of 20–30 R⊙. This means that particle acceleration at coronal mass ejection (CME)-driven shocks is also computed from this boundary onwards, leading to simulated SEP event onsets that can be many hours later than observed, since shock waves can form much lower in the solar corona. In this work, we aim to improve the modelled onset of SEP events by inserting a “fixed source” of particle injection at the outer boundary of the coronal domain of the coupled WSA–Enlil 3D MHD model of the heliosphere. The SEP model that we employ for this effort is Solar Energetic Particle MODel (SEPMOD), a physics-based test-particle code based on a field line tracer and adiabatic invariant conservation. We apply our initial tests and results of SEPMOD’s fixed-source option to the 2021 October 9 SEP event, which was detected at five well-separated locations in the inner heliosphere – Parker Solar Probe, STEREO-A, Solar Orbiter, BepiColombo, and near-Earth spacecraft.
Abstract Various upstream spacecraft have now observed the solar wind conditions affecting the Earth since the 1970s, covering over four solar activity cycles. These measurements provide a long term picture of the related patterns in large scale incident plasma and magnetic field parameters of interest for both interpreting cycles in geospace effects, and understanding how the Sun controls our space environment. This paper focuses on the latter, in part to provide context at the start of the new solar cycle 25, and toward establishing connections between the 1 AU ecliptic solar wind behavior and the unprecedented near‐Sun measurements of heliospheric features on Parker Solar Probe and Solar Orbiter. Magnetograph data‐based potential field source surface models provide a basic picture of how the solar wind sources, including those that give rise to corotating high speed streams in the ecliptic, have changed since the beginning of the record of regular solar wind measurements. In particular, they suggest the contributions from low to mid latitude coronal holes dominate the observed cycles (21–24), especially the weaker cycles (23 and 24), impacting upstream measurement interpretations, modeling, and forecasting considerations. For example, recurring features are affected by differential rotation of the Sun's surface field, which through its effects on the corona, can produce solar wind streams reappearing at ∼25–30 days intervals instead of at the canonical 27.3 days Carrington rotation rate. In addition, the conditions that lead to the corotating stream structure that can dominate periods of low solar activity are seen to be more complicated than suggested by the simple concepts of early studies. The overall results illustrate where in the cycles well‐defined, long‐lived large scale structures can be expected, and the advantages of synoptic displays of 1 AU solar wind parameters for anticipating timings of recurring features.
Turbulence, the self-generated turbulence by plasmas and magnetic field collective interaction, has been found to play an essential role in energizing charged particles in the large-scale reconnecting current sheet in the major solar eruption. The typical large-scale CME/Flare events involve sudden bursts of particle acceleration from the sudden release of magnetic energy in a few minutes to a few tens of minutes. The X-rays emission and gamma rays burst produced by the combined result from the interactions of electrons, hydrogen, helium, and other heavier ions. Space and laboratory researchers are more inclined to believe that turbulence acceleration is belonged to shock acceleration. Solar and astrophysics researchers are more inclined to believe that turbulence acceleration is an independent acceleration mechanism that belongs to the flare acceleration. The evidence in both theories and observations from solar atmosphere activities shows that the acceleration is related to nonlinear resonant wave-particle interaction (e.g., Landau acceleration). So far, many-particle acceleration models consider turbulence acceleration as an effective way of generating energetic electrons, protons, and heavier ions. However, the detailed role of turbulence in this process remains unclear. More effort needs to invest in looking into particle accelerations by turbulence that occurs over a large range of the scale in space from the inertial scale of individual particles to the MHD scale. In this work, applying the statistical treatment of plasma physics, combing with filter theory of turbulence, the actual ratio of the proton mass to the electron mass, and mass-to-charge ratios, we investigate the interaction of charged particles with the turbulent electric field and magnetic field in the large-scale CME/flare current sheet by applying the We found the significant Langmuir turbulence acceleration (LTA) through the nonlinear resonant wave-particle interaction in the diffusion region via tracking the trajectories and analyzing the energy spectrum of energetic protons and electrons. The results show that protons and electrons could be efficiently accelerated simultaneously and that the way of LTA is similar to that of the shock acceleration}} but is much more efficient than the shock acceleration. This indicates that large-scale reconnection is a good candidate for the mechanism for the efficient acceleration of protons and electrons in the major solar eruption. The acceleration of heavy ion considered Helium (3He/4He) and other heavy elements in 3He-rich flares burst would explore in the follow-up work series. URL: https://pan.cstcloud.cn/s/drEdcjIaT8E
AbstractPredictions of coronal mass ejections (CMEs) and solar energetic particles (SEPs) are a central issue in space weather forecasting. In recent years, interest in space weather predictions has expanded to include impacts at other planets beyond Earth as well as spacecraft scattered throughout the heliosphere. In this sense, the scope of space weather science now encompasses the whole heliospheric system, and multipoint measurements of solar transients can provide useful insights and validations for prediction models. In this work, we aim to analyze the whole inner heliospheric context between two eruptive flares that took place in late 2020, that is, the M4.4 flare of 29 November and the C7.4 flare of 7 December. This period is especially interesting because the STEREO‐A spacecraft was located ∼60° east of the Sun–Earth line, giving us the opportunity to test the capabilities of “predictions at 360°” using remote‐sensing observations from the Lagrange L1 and L5 points as input. We simulate the CMEs that were ejected during our period of interest and the SEPs accelerated by their shocks using the WSA–Enlil–SEPMOD modeling chain and four sets of input parameters, forming a “mini‐ensemble.” We validate our results using in situ observations at six locations, including Earth and Mars. We find that, despite some limitations arising from the models' architecture and assumptions, CMEs and shock‐accelerated SEPs can be reasonably studied and forecast in real time at least out to several tens of degrees away from the eruption site using the prediction tools employed here.
We study solar wind anomalies and their associations with solar wind structures using the STEREO solar wind and suprathermal electron (STE) data from IMPACT and PLASTIC. We define solar wind anomalies as temporary and local excursions from the average solar wind state, regardless of their origins, for six anomalies: sunward strahls, counterstreaming suprathermal electrons, suprathermal electron depletions, nearly radial magnetic field episodes, anomalously low proton temperatures, and anomalously low proton beta. We first establish the solar wind synoptic contour displays, which show the expected variations in solar wind structure during the solar cycle: recurrent corotating heliospheric magnetic field (HMF) and stream structures are dominant during solar quiet times around the solar minimum (2008 December) preceding cycle 24, while complex structures characterize solar active times around the solar maximum (2014 April). During the declining phase of the cycle (2016–2019), the stream structures remain complex, but the HMF sectors show the structures of the solar minimum. We then systematically study the six anomalies by analyzing the STE data using automated procedures. All anomalies present some degree of dependence on the large-scale solar wind structure, especially around the solar minimum, implying that the solar wind structure plays a role in either the generation or transportation of these anomalies. One common feature of all of the anomalies is that the distributions of the durations of the anomalous episodes all peak at the 1 hr data resolution, but monotonically decrease over longer durations, which may arguably imply that solar anomalies occur on a continuum of temporal and spatial scales.
Considering that the measurement devices of the distribution network are becoming more and more abundant, on the basis of the traditional Supervisory Control And Data Acquisition (SCADA) measurement system, Phasor measurement unit (PMU) devices are also gradually applied to the distribution network. So when estimating the state of the distribution network, the above two devices need to be used. However, because the data of different measurement systems are different, it is necessary to balance this difference so that the data of different systems can be compatible to achieve the purpose of effective utilization of the estimated power distribution state. To this end, this paper starts with three aspects of data accuracy of the two measurement systems, data time section and data refresh frequency to eliminate the differences between system data, and then considers the actual situation of the three-phase asymmetry of the distribution network. The three-phase state estimation equations are constructed by the branch current method, and finally the state estimation results are solved by the weighted least square method.
Magnetic clouds (MCs) are transient magnetic structures giving the strongest southward magnetic field (Bz south) in the solar wind. The sheath regions of MCs may also carry a southward magnetic field. The southward magnetic field is responsible for space-weather disturbances. We report a comprehensive analysis of MCs and Bz components in their sheath regions for 1995 to 2017. 85% of 303 MCs contain a south Bz up to 50 nT. Sheath Bz during the 23 years may reach as high as 40 nT. MCs of the strongest magnetic magnitude and Bz south occur in the declining phase of the solar cycle. Bipolar MCs depend on the solar cycle in their polarity, but not in the occurrence frequency. Unipolar MCs show solar-cycle dependence in their occurrence frequency, but not in their polarity. MCs with the highest speeds, the largest total- $B$ magnitudes, and sheath Bz south originate from source regions closer to the solar disk center. About 80% of large Dst storms are caused by MC events. Combinations of a south Bz in the sheath and south-first MCs in close succession have caused the largest storms. The solar-cycle dependence of bipolar MCs is extended to 2017 and now spans 42 years. We find that the bipolar MC Bz polarity solar-cycle dependence is given by MCs that originated from quiescent filaments in decayed active regions and a group of weak MCs of unclear sources, while the polarity of bipolar MCs with active-region flares always has a mixed Bz polarity without solar-cycle dependence and is therefore the least predictable for Bz forecasting.
As solar activity steadily declined toward the cycle 24 minimum in the early months of 2017, the expectation for major solar energetic particle (SEP) events diminished with the sunspot number. It was thus surprising (though not unprecedented) when a new, potentially significant active region rotated around the East limb in early July that by midmonth was producing a series of coronal eruptions, reaching a crescendo around 23 July. This series, apparently associated with the birth of a growing pseudostreamer, produced the largest SEP event(s) seen since the solar maximum years. Activity abated with the decay of the active region, but a second episode of magnetic flux emergence in the same area in early September initiated a new round of eruptions. The western longitude of the erupting region, together with its similar coronal setting in both cases, resulted in a set of nearly homologous multipoint SEP event periods at Earth, Solar TErrestrial RElations Observatory‐A and Mars (Mars Atmosphere and Volatile EvolutioN) for July and September 2017. We use a combination of WSA‐ENLIL‐cone heliospheric simulation results, together with SEPMOD SEP event modeling, to illustrate how the event similarities at the three observer sites can be understood from their relative positions and their connectivities to the generated interplanetary shocks.
proxy the the for G the to calculate the torsional
The response of Mars to the major space weather events called interplanetary coronal mass ejections (ICMEs) is of interest for both general planetary solar wind interaction studies and related speculations on their evolutionary consequences—especially with respect to atmosphere escape. Various particle and field signatures of ICMEs have been observed on Phobos‐2, Mars Global Surveyor (MGS), Mars Express (MEX), and now Mars Atmosphere and Volatile EvolutioN (MAVEN). Of these, MAVEN's combined instrumentation and orbit geometry is particularly well suited to characterize both the event drivers and their consequences. However, MAVEN has detected only moderate disturbances at Mars due in large part to the general weakness of the present solar cycle. Nevertheless, the strongest event observed by MAVEN in March 2015 provides an example illustrating how further insights can be gained from available models. Here we first look more closely at what previously run BATS‐R‐US MHD simulations of the combined MAVEN observations tell us about the March 2015 event consequences. We then use analogous models to infer those same responses, including magnetic field topology changes and ionospheric consequences, to a hypothetical extreme ICME at Mars based on STEREO A measurements in July 2012. The results suggest how greatly enhanced, yet realistic, solar wind pressure, magnetic field, and convection electric field combine to produce strong magnetospheric coupling with important consequences for upper atmosphere and ionosphere energization.
Much can be learned from terrestrial planets that appear to have had the potential to be habitable, but failed to realize that potential. Mars shows evidence of a once hospitable surface environment. The reasons for its current state, and in particular its thin atmosphere and dry surface, are of great interest for what they can tell us about habitable zone planet outcomes. A main goal of the MAVEN mission is to observe Mars' atmosphere responses to solar and space weather influences, and in particular atmosphere escape related to space weather 'storms' caused by interplanetary coronal mass ejections (ICMEs). Numerical experiments with a data-validated MHD model suggest how the effects of an observed moderately strong ICME compare to what happens during a more extreme event. The results suggest the kinds of solar and space weather conditions that can have evolutionary importance at a planet like Mars.
Solar energetic particle (SEP) event modeling has gained renewed attention in part because of the availability of a decade of multipoint measurements from STEREO and L1 spacecraft at 1 AU. These observations are coupled with improving simulations of the geometry and strength of heliospheric shocks obtained by using coronagraph images to send erupted material into realistic solar wind backgrounds. The STEREO and ACE measurements in particular have highlighted the sometimes surprisingly widespread nature of SEP events. It is thus an opportune time for testing SEP models, which typically focus on protons similar to 1-100 MeV, toward both physical insight to these observations and potentially useful space radiation environment forecasting tools. Some approaches emphasize the concept of particle acceleration and propagation from close to the Sun, while others emphasize the local field line connection to a traveling, evolving shock source. Among the latter is the previously introduced SEPMOD treatment, based on the widely accessible and well-exercised WSA-ENLIL-cone model. SEPMOD produces SEP proton time profiles at any location within the ENLIL domain. Here we demonstrate a SEPMOD version that accommodates multiple, concurrent shock sources occurring over periods of several weeks. The results illustrate the importance of considering longer-duration time periods and multiple CME contributions in analyzing, modeling, and forecasting SEP events.
AbstractOne view of major Solar Energetic Particle (SEP) events is that these (proton-dominated) fluxes are accelerated in heliospheric shock sources created by Interplanetary Coronal Mass Ejections (ICMEs), and then travel mainly along interplanetary magnetic field lines connecting the shock(s) to the observer(s). This places a particular emphasis on the role of the heliospheric conditions during the event, requiring a realistic description of the latter to interpret and/or model SEP events. The well-known ENLIL heliospheric simulation with cone model generated ICME shocks is used together with the SEPMOD particle event modeling scheme to demonstrate the value of applying these concepts at multiple inner heliosphere sites.
(1) Catholic University of America, Washington, DC, USA (m.leila.mays@nasa.gov), (2) Heliophysics Science Division, NASA Goddard Space Flight Center, Greenbelt, MD, USA, (3) George Mason University, Fairfax, VA, USA, (4) Space Sciences Laboratory, University of California, Berkeley, CA, USA, (5) University of New Hampshire, Durham, New Hampshire, USA, (6) University of Maryland, College Park, MD, USA, (7) Space Research Institute, Austrian Academy of Sciences, Graz, Austria, (8) Institut de Recherche en Astrophysique et Planétologie, Université de Toulouse, Toulouse, France, (9) RAL Space, Rutherford Appleton Laboratory, Harwell Oxford, UK, (10) Institute of Physics, University of Graz, Graz, Austria
Stealth coronal mass ejections (CMEs) are events in which there are almost no observable signatures of the CME eruption in the low corona but often a well-resolved slow flux rope CME observed in the coronagraph data. We present results from a three-dimensional numerical magnetohydrodynamics (MHD) simulation of the 1-2 June 2008 slow streamer blowout CME that Robbrecht et al. (2009) called "the CME from nowhere." We model the global coronal structure using a 1.4 MK isothermal solar wind and a low-order potential field source surface representation of the Carrington Rotation 2070 magnetogram synoptic map. The bipolar streamer belt arcade is energized by simple shearing flows applied in the vicinity of the helmet streamer's polarity inversion line. The flows are large scale and impart a shear typical of that expected from the differential rotation. The slow expansion of the energized helmet streamer arcade results in the formation of a radial current sheet. The subsequent onset of expansion-induced flare reconnection initiates the stealth CME while gradually releasing the stored magnetic energy. We present favorable comparisons between our simulation results and the multiviewpoint SOHO-LASCO (Large Angle and Spectrometric Coronagraph) and STEREO-SECCHI (Sun Earth Connection Coronal and Heliospheric Investigation) coronagraph observations of the preeruption streamer structure and the initiation and evolution of the stealth streamer blowout CME.
 Janet Luhmann合作论文数Space Sciences Laboratory, University of California, Berkeley64
 Benjamin James Lynch合作论文数22
 Emilia Kilpua合作论文数Department of Physics, Faculty of Science, University of Helsinki16
 Charles Nickolos Arge合作论文数Solar Physics Laboratory, NASA Goddard Space Flight Center14
 C. O. Lee合作论文数Space Sci Lab, Univ Calif Berkeley13
 George H Fisher合作论文数Department of Chemistry, University of Miami13
 C.T. Russell合作论文数Institute of Geophysics and Planetary Physics, University of California, Los Angeles;Department of Earth, Planetary, and Space Sciences, College of Physical Sciences, University of California, Los Angeles12
 Brian Welsch合作论文数Space Sciences Laboratory, University of California at Berkeley;University of Wisconsin Green Bay11
 Angelos Vourlidas合作论文数Applied Physics Laboratory, Johns Hopkins University9
 Antoinette B. Galvin合作论文数Dept. of Physics and Astronomy, University of Maryland9
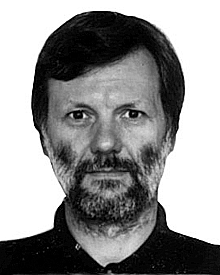 Dusan Odstrcil合作论文数9
 J. Todd Hoeksema合作论文数Institute for Plasma Research;Stanford University;Institute for Plasma Research, Stanford University9Hazel Bain合作论文数9
 Lan Jian合作论文数Heliophysics Science Division, NASA Goddard Space Flight Center8
 Richard Mewaldt合作论文数Aspen Global Change Institute;Space Radiation Laboratory, California Institute of Technology5
 C. M. S. Cohen合作论文数CALTECH, Pasadena, CA 91125 USA5
 Lide Zhang (张立德)合作论文数Institute of Solid State Physics, Chinese Academy of Sciences5
 Russell Howard合作论文数Johns Hopkins University Applied Physics Laboratory5Petrie Gordon合作论文数National Solar Observatory4Yang Liu合作论文数4M. L. Mays合作论文数4
 Davin Larson合作论文数Space Sciences Laboratory, University of California, Berkeley4
 Spiro Kosta Antiochos合作论文数Goddard Space Flight Center, National Aeronautics and Space Administration4
 Peter J Macneice合作论文数Goddard Space Flight Center, National Aeronautics and Space Administration4Arnaud Thernisien合作论文数4Carl Richard DeVore合作论文数Space Weather Laboratory, Heliophysics Science Division, NASA Goddard Space Flight Center4v g toy合作论文数3xianping zhao合作论文数3
 Chenglong Shen (申成龙)合作论文数Division of Space Physics, School of Earth and Space Sciences, University of Science and Technology of China3
 Lei Yang (杨雷)合作论文数College of Materials Science and Engineering, Hunan University3
 Monica G. Bobra合作论文数State of California, Office of Data and Innovation3
 Xudong Sun合作论文数Stanford University, Stanford Univ3Tamitha Lynne Mulligan合作论文数3
 Stuart Bale合作论文数Department of Physics, University of California, Berkeley;Space Sciences Laboratory, University of California, Berkeley3
 Ying Liu (刘颍)合作论文数National Space Science Center, Chinese Academy of Sciences;University of Chinese Academy of Sciences3Sebastien Couvidat合作论文数3R. A. Leske合作论文数3Roger K. Ulrich合作论文数3K. D. C. Simunac合作论文数3
 Pete Riley合作论文数Predictive Science Inc.3
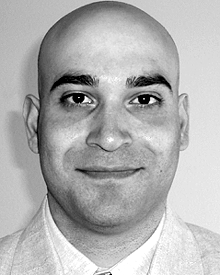 Aimee A. Norton合作论文数3
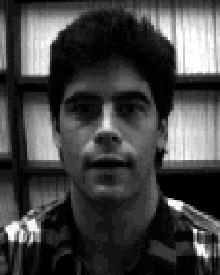 Jon A. Linker合作论文数Science Applications;International Corporation;Science Applications, International Corporation3Xuepu Zhao合作论文数3
 Robert P Lin (林伯中)合作论文数Space Sciences Laboratory, University of California, Berkeley3Guillermo Stenborg合作论文数3p a schroeder合作论文数2r w nightingale合作论文数2thomas narock合作论文数2
 Chuanfei Dong合作论文数Department of Astronomy, Boston University;Discovery Plasma Science Department, Princeton Plasma Physics Laboratory;Department of Astrophysical Sciences, Princeton University2




