This perspective presents a new framework to improve ecological contributions to understanding how urban, rural, and wild attributes can co-occur and mix within specific locations, producing configurations that cannot be understood through binary contrasts. We focus on mixed conditions and the processes that sustain dynamic mosaics of mixed urban-rural sites. This framework complements others that avoid the urban-rural binary, and supports integrated social and ecological research across landscapes of mixture.
Climate change reshapes forest biophysical effects, yet the impact direction and strength remain uncertain. Here we quantify the growing-season land surface temperature between forests and adjacent open land (triangle LSTgs) and show contrasting temporal trends in triangle LSTgs across the globe during 2001-2023. Rising vapour pressure deficit (VPD) has emerged as the primary driver of these contrasting trends, surpassing other common climatic factors. By contrast, plant anisohydricity-an indicator of stomatal regulation behaviour-is the most important forest trait that negatively modulates the strength of the triangle LSTgs response to VPD variability. At low latitudes, forests are more isohydric, and rising VPD has exceeded the hydraulic safety margin, resulting in weakened cooling. Conversely, high-latitude forests are more anisohydric; VPD remains below the safety margin, and rising VPD thus leads to enhanced cooling. These results highlight that the overall climate benefits of global forests may be undermined if global VPD continues to intensify in future.
Climate change poses an escalating threat to global public health. However, the diseases related to climate change have not been fully recognized due to the lack of a direct mechanistic link between nonoptimal ambient temperature exposure and human diseases. Here, we present a multi-scale network framework integrating transient receptor potential ion channel biology with human disease interactome to comprehensively delineate the potential impacts of climate change on 299 human diseases. We find the majority of known diseases are closely linked to ambient temperature exposure at the molecular mechanistic level. Our projections indicate that global warming will directly lead to an increase of over 12% in the risks of non-communicable and non-congenital human diseases across over 95% of the world's inhabited land by the mid-21st century, thereby impacting over 97% of the global population, compared with the early 21st century. Limiting warming to below 2 ℃ this century can effectively control this surge in disease risks. This work uncovers previously unrecognized health risks directly attributable to temperature exposure from climate change, offers a new paradigm for reshaping our understanding of climate-health causality, and provides scalable tools to mitigate climate-driven disease burdens in an increasingly warming world.
Urban vegetation mitigates heat through evapotranspiration (ET) and shading, and quantitatively characterizing these two pathways is essential for comparable cross-city assessment and for identifying climate-specific limiting factors. However, a standardized and physically based framework to quantify and compare these cooling effects across different cities and climatic contexts is still lacking. Existing metrics, such as evapotranspiration-induced cooling of vegetation (ECoV) and shading-induced cooling of vegetation (SCoV), are typically applied within individual cities. To address this, we developed a transferable framework that integrates a physically based Soil-Canopy-Observation of Photochemistry and Energy (SCOPE) - Surface Energy Balance (SEB) model for evapotranspiration-related cooling with surface temperature analysis for shading-related cooling. Evapotranspiration-related cooling (Delta T-LE) is quantified through the SCOPE-SEB framework, whereas shading-related cooling (Delta T-Shade) is independently derived from surface temperature contrasts, enabling consistent cross-city comparison under extreme heat conditions. We evaluated the model at eddy-covariance flux towers in four mid-latitude cities representing hot-desert (Phoenix, Las Vegas) and Mediterranean (Rome, Florence) climates. The model demonstrated strong performance: turbulent heat fluxes (sensible, H, and latent, LE) were reconstructed with R-2 = 0.56-0.78, while surface temperature (T-s) was simulated with R-2 = 0.47-0.95. Modeled aerodynamic resistance showed lower agreement with tower-derived estimates and decreased with increasing wind speed. Crucially, the model achieved robust energy balance closure, with residuals of only similar to 3-7%. Specifically, we revealed that: (1) The magnitude of daytime Delta T-LE was greater in Mediterranean cities (-1.98 degrees C) than in hot-desert cities (-1.34 degrees C), whereas daytime Delta T-Shade was significantly stronger in Mediterranean cities (-2.60 degrees C vs. -0.90 degrees C). Spatially, deserts exhibited extensive daytime warming patches in Delta T-Shade and lower heterogeneity in Delta T-LE, contrasting with the widespread, strong cooling and higher intra-urban variability of Mediterranean cities. (2) The primary controls were climate-dependent: cooling in water-limited deserts was dominated by soil moisture and leaf water/chlorophyll content, whereas in Mediterranean cities, canopy structure (height, LAI) governed both Delta T-LE and Delta T-Shade, with meteorology playing a secondary modulating role. This mechanism-explicit, physically consistent framework provides a transformative tool for cross-city comparison of vegetation-based heat mitigation, enhancing our understanding of climate-dependent ecosystem services.
Rapid urbanization has profoundly modified urban climate conditions all over the world. Climatic differences between urban and natural contexts may lead to variations in the physiological and ecological functions of plants, especially transpiration. Previous research on differences in plant transpiration between urban and natural contexts remains limited, with studies involving shrubs being particularly scarce. In this study, we compared transpiration rate (Tr) of shrubs between at urban and natural sites by conducting a global-scale synthesis from 207 studies across seven climate zones to fill this gap. Average value of Tr of shrubs during the growing season was 3.99 +/- 0.11 (mmol m-2 s-1), which varied across climate zones. Tr was significantly higher in arid zones than in cold and temperate zones, globally and at both urban and natural sites. However, the variations of Tr at urban sites across climate zones were smaller than at natural sites, which may be due to urban eco-environmental homogenization. Tr was higher at urban sites than at natural sites in most climatic zones after controlling for the same families. This pattern may be attributed to the faster positive responses of Tr of urban shrubs to photosynthetically active radiation, air temperature, and vapor pressure deficit compared to their natural counterparts. Revealing the variations of Tr between urban and natural areas across different climate zones would be critical to the understanding of the effect of urbanization on urban plants.
Urban green spaces (UGS) play an important role in mitigating urban heat island effects. However, the mechanisms underlying their cooling effects are still not fully understood, particularly regarding the role of three-dimensional vegetation structure and nonlinear threshold responses. This study employed a multidimensional analytical framework integrating two-dimensional vegetation cover, three-dimensional canopy structure, and landscape configuration to investigate UGS cooling effects across nine representative Chinese cities spanning subtropical to semi-arid temperate climates. Multi-source remote sensing datasets, including Landsat-8, ECOSTRESS, and high-resolution canopy height data, were integrated with an interpretable machine learning approach (XGBoost–SHAP) to quantify the spatial heterogeneity, diurnal asymmetry, and nonlinear responses of UGS cooling. Compared with conventional linear models, this framework was more effective in capturing nonlinear relationships and quantifying the relative contributions of individual predictors. The results indicated notable nonlinear threshold effects associated with vegetation structure. Cooling intensity increased rapidly when vegetation cover exceeded approximately 0.33 and gradually approached saturation near 0.65. Mean canopy height also exhibited a threshold effect around 6.33 m, above which cooling intensity generally increased across cities. Clear diurnal asymmetry was observed. Daytime cooling was stronger and mainly governed by vegetation cover and canopy height, whereas nighttime cooling was weaker and more strongly associated with landscape configuration metrics. In addition, southern cities generally exhibited stronger cooling effects (mean: 1.05 °C ± 0.52 °C) than northern cities (mean: 0.81 °C ± 0.25 °C). These findings provide new insights into the nonlinear and spatially heterogeneous mechanisms underlying UGS cooling and offer methodological support for climate-adaptive urban green infrastructure planning and urban thermal environment management.
Urbanization drives habitat loss and fragmentation, posing serious threats to biodiversity. Butterfly is a key bioindicator taxon for assessing urban ecosystem health. Many studies have investigated the effects of park features and within-park configuration on butterfly diversity separately. However, their relative importance and potential interactions remain poorly understood. We address this issue based on field-based butterfly surveys with landscape pattern metrics, focusing on the urban parks within the fifth Ring Road of Beijing. We found at the park level, park size was positively correlated only with total abundance, showing no significant association with richness or the Shannon-Wiener index. In contrast, the perimeter-area ratio (PARA) showed a significantly negative correlation with both richness and the Shannon-Wiener index. The within-park configuration also significantly affects butterfly diversity. The mean patch size (AREA_AM) was positively correlated with all three diversity indices, and the largest patch index (LPI) was a significant predictor of the Shannon-Wiener index. The comparison of the relative importance showed that PARA had a stronger negative effect on richness and the Shannon-Wiener index than within-park configuration metrics, highlighting the critical role of park shape. For total abundance, park size was the only significant predictor. More importantly, a significant interaction was observed between park size and PARA for the Shannon-Wiener index. More specifically, the negative effect of PARA diminished with the increase of park size, indicating that optimizing park shape is particularly effective for enhancing butterfly diversity in small parks, whereas increasing total habitat area in large parks can buffer the negative effects of irregular shapes. These findings provide important insights on urban park management for biodiversity conservation.
Although green cover within cities provides multiple benefits for physical and mental health, it has long been under pressure during urban expansion and densification. Previous studies have generally reported a negative relationship between urban density and greenery, yet potential spatial variations between them remain insufficiently explored. Here, we provide a three-dimensional perspective to investigate the spatial patterns of green cover and building density in Shenzhen, a megacity in southern China. Based on an analysis of more than 6000 residential plots using a 0.8 m green cover map and building footprint data with height information, we found that the greenery and density, measured by green cover percentage and floor area ratio (FAR), exhibited spatial mismatches. These spatial mismatches further revealed a non-linear relationship, with a tipping point occurring at an FAR of 2.1, suggesting that the urban greenery and density can potentially coexist. The bivariate mapping showed that 36.3% of the plots fall into a priority optimization category characterized by high density coupled with insufficient greenery. Meanwhile, 34.9% of the plots exhibited both high levels of density and greenery. These “bright spots” were mostly characterized by high-rise buildings that help release ground-level space for greening. These findings help identify priority areas for targeted greening and support balancing intensive urban development with ecological sustainability.
Urban greenspace supports human health and reduces mortality risks through multiple pathways, yet the global health impacts of its long-term dynamics remain poorly quantified. Here, we conduct a global health impact assessment to estimate premature mortality among adults (aged ≥20 years) attributable to changes in urban greenness from 2000 to 2019. Results show that cities experienced simultaneous greening and browning, generating substantial health gains and losses, respectively, with net benefits overall but highly heterogeneous in space. High-income countries were dominated by gains, while upper-middle-income countries exhibited large swings in both gains and losses, ultimately resulting in the highest net benefits. Lower-middle-income countries realized smaller net benefits, and low-income countries experienced minor losses. Within cities, health benefits were concentrated in inner-city areas rather than in edge-sprawl regions. Our findings highlight the magnitude, direction, and uneven distribution of health impacts from urban greenness dynamics, underscore the importance of equitable greening strategies, and point to persistent data gaps.
The 11th Sustainable Development Goal highlights the urgent need to provide universal access to greenspace for urban residents. Both urban parks and residential greenspaces are important for residents due to similar functions, but previous studies have mostly focused on parks when addressing greenspace inequality. Here, we addressed this issue by simultaneously considering accessibility to residential greenspaces and parks (comprehensive accessibility), focusing on Beijing, China. We found that the accessibility based on both urban greenspaces (UGSs) differed greatly from that considering only urban parks or residential greenspaces. Comprehensive accessibility revealed unrecognized UGS shortages, with 10.87 % of residential areas (RAs) having limited access to both UGS types. Residential greenspaces and parks are spatially complementary to some degree, but should be more so. Among RAs with limited access to one type of greenspace, >30 % have high access to the other, but nearly one-third still have low access to the other. Given parks' public ownership and current extensive urban renewal projects, adding pocket parks in greenspace-deficient areas, especially limited access to both UGS types, is a feasible and effective solution to narrow UGS inequality.
Urban expansion and ecological conservation are central concerns in sustainable urbanization research. While, most cities evolve over centuries, making it hard to capture complete urban-ecological dynamics. One of the most typical cities, Shenzhen, however, underwent an exceptionally rapid transformation from its establishment in 1979 to a highly urbanized metropolis in less than fifty years, providing a rare, complete, and quantifiable case for understanding the urban-ecological dynamic. This study thus integrates theoretical assumption on urban expansion and ecological conservation with long-term Landsat imagery from 1979 to 2024 and landscape pattern indices to explore the spatiotemporal dynamics of urban and ecological spaces in Shenzhen. The results show that the UbS expanded from 35.86 km2 to 971.13 km2 over 46 years, while forest area decreased from 1437.33 km2 to 852.18 km2, accompanied by significant losses in farmland and wetlands. These changes reflect a fundamental shift in the city's landscape structure from an "ecology-dominated" system to a "dual urban-ecological" system. Based on quantitative trajectory characteristics, including the growth rates of urban and ecological space and their intersection timing, Shenzhen's districts were classified into three types that are intense-type districts, characterized by continuous urban expansion, severe ecological fragmentation, and habitat loss; stable-type districts, exhibiting consolidated high-density urban patterns with persistent ecological fragmentation; and slow-type districts, defined by limited urban growth, large contiguous ecological cores, and minimal human disturbance. This classification framework reveals the dominant patterns and temporal trajectories of urban-ecological evolutions and provides a context-sensitive methodological reference for development-type delineation and differentiated ecological management in other rapidly urbanzing districts.
Rural livelihood strategies significantly influence socio-ecological systems and sustainability outcomes. However, spatially explicit data on livelihood compositions remain scarce at national scales. We developed a Deep Rural Livelihood Model (DRLM) combining satellite imagery (Landsat, VIIRS) with household survey data to map four livelihood strategy probabilities across rural China in 2020: farming-only (F), farming-dominated mixed (F_NF), non-farming-dominated mixed (NF_F), and non-farming-only (NF). Using quantile-regression XGBoost, we expanded survey-derived labels from 283 rural observation sites to 38,306 rural settlements and trained a dual-branch ResNet architecture with Dirichlet regression. Agreement with the expanded settlement-level labels was high, whereas independent validation against actual survey data showed moderate performance, with stronger support for dominant livelihood categories than for mixed categories. This dataset provides settlement-scale probabilistic information to support analyses of rural transformation, sustainability-related indicators, and socio-ecological change.
China’s Sponge City Program (SCP), the world’s largest urban green spaces (UGSs) retrofitting initiative for mitigating waterlogging and pollution, holds underappreciated potential for reconstructing plant communities. Here, we demonstrate that across 1,973 sponge city green infrastructures (SCGIs) in Wuxi, the SCP significantly enhances plant diversity (increased plant coverage, species richness, evenness, and reduced dominance), synchronizing its distribution at a high level across the catchment. We find that biodiverse designs (e.g., rain gardens [RGs], bioswales [BSs]) alongside linear project implementation are key drivers and propose a strategic network approach to maximize gains by embedding SCGIs in UGS planning, leveraging linear projects as potential corridors and employing multifunctional designs. This work reconciles stormwater management with biodiversity conservation, supporting China’s commitment to the Kunming-Montreal Global Biodiversity Framework (GBF) Target 12 through improved UGS area, quality, and connectivity. These insights offer actionable pathways for subtropical/tropical Asian cities to enhance ecological resilience amidst rapid urbanization.
Increasingly frequent and extreme heat is posing significant threats to urbanites. Green roofs have emerged as a promising nature-based solution to mitigate urban heat, but their cooling potential at a global scale remains unquantified. Here, using ultra-high-resolution building footprint data, we simulated and assessed the cooling potential of roof greening for global cities. Our estimates indicate that roof greening has the potential to reduce land surface temperatures (LST) across global cities by 0.57-1.58 degrees C during the day and 0.14-0.39 degrees C at night, depending on the extent of roof greening. Asia showed the greatest cooling benefit to urban population despite not having the highest cooling potential. Moreover, green roofs provided additional benefits by reducing the diurnal temperature range by 0.39-1.10 degrees C due to higher cooling potential during the day than at night. These results highlight the substantial cooling potential of roof greening on a global scale, providing a scientific basis to inform urban climate mitigation policies.
Climatic and anthropogenic disturbances have led to intense small-scale tree cover loss in global forests. However, it remains unclear when forest attributes at a large scale (e.g., 0.05° resolution) will decline in response to such sub-grid (e.g., 30-m) tree cover losses within forest ecosystems. Utilizing global maps of forest attribute proxies, we discover that vegetation greenness, canopy structure, composition, and photosynthesis function can all increase under limited tree cover loss, indicating a widely existing safety margin in global forests that is primarily buffered by a positive edge effect of landscape fragmentation within forest ecosystems. The safety margin varies across biomes (tropical: 7.7%; temperate: 3.7%; boreal: 1.0%) and is often positively correlated with ecosystem resistance. In addition, about 35.7% of the remaining global forests have exceeded the safety margin. Our finding contrasts with the conventional perception that sub-grid tree cover losses are inevitably associated with declines in forest attributes and functions. It provides quantitative information for mitigating forest degradation and has strong implications for sustainable forest management practices.
Rapid urbanization and intense human activities of urban agglomerations (UAs) have changed the structure and function of ecosystems, thereby significantly influencing regional ecosystem services (ESs). Numerous studies have conducted quantitative analysis on the impact of urbanization on ESs and showed that urban expansion caused a degradation of ESs. However, to what extent urban expansion encroached on ecological lands providing multiple types of high-level ESs around urban area and thereby impact ES supply-demand balance remains unclear. Addressing such question is crucial for balanced regional supply-demand of ESs and urban sustainability. Here we investigate the impact of urban expansion on regional vital ESs and test the effect of these changes on supply- demand balance of ESs. We found that: 1) Over 30% of areas simultaneously provided two or more types of vital ESs in Chinese three UAs. 2) Approximately 10 similar to 20% of areas with vital ESs was converted to non-vital level in three UAs from 2000 to 2020. Meanwhile, we found the percent cover of land providing three or more types of vital ESs decreased in all the three UAs. 3) The occupation of ecological lands caused by urban expansion led to substantial loss of vital ESs in new urban areas. The areas lost vital ESs within new urban areas accounted for over 20% in all three UAs. 4) over 30% of conservation priority areas with "vital ESs supply-vital ESs demand" have experienced a loss of vital ES supply in all three UAs, indicating the imbalance in ES supply and demand was severely deteriorated. Our results underscore that urban expansion has encroached upon a large proportion of critical areas that provide multiple vital ESs, particularly those crucial for maintaining local ES supply-demand balance. Our findings provide new insights into identifying priority conservation areas by integrating ES multifunctionality with changes in ES supply-demand relationship associated with urban expansion.
Growing epidemiological evidence shows that exposure to greenspace benefits mental, physical and social health. Numerous studies have examined the preventable disease and economic burdens associated with greenspace change across cities. However, greenspace dynamics and socially vulnerable populations are highly spatially heterogeneous within urban areas, raising concerns about the equity of greenspace-related health benefits. Here, we conducted a case study in five Chinese megacities with diverse geographical and socioeconomic characteristics, including Beijing, Shanghai, Guangzhou, Changsha, and Chengdu. Following the health impact assessment framework, the averted deaths associated with greenspace changes from 2000 to 2020 were estimated at the subdistrict level and their spatial associations with per capita GDP, population density and aging were further examined. The results showed that the estimated number of averted premature deaths associated with greenspace changes reached 23 per 100,000 population (95% CI: 17–35) across the five cities in 2020, approximately six times higher than the 2010 estimate of 4 (95% CI: 3–6), although significant spatial variations persisted within cities. In all five cities, the mortality reduction benefits were mostly clustered in the urban central areas, coinciding with areas of higher social vulnerability. The findings suggest that urban greenspace expansion in Chinese megacities has generated substantial public health benefits over the past two decades and has supported the needs of vulnerable populations in urban central areas. However, targeted planning strategies are still needed to better serve vulnerable groups in peripheral or central areas depending on the city development stage and to reduce intra-urban disparities.
Quantifying the vertical structure of urban landscapes is the prerequisite to understand its social and ecological impacts. Remote sensing provides an important tool for data acquisition and pattern analysis on the vertical structure of urban landscapes. Therefore, a comprehensive review of how remote sensing can facilitate the quantification of the vertical structure of urban landscapes is not only desirable for the remote sensing community but also for the increasing number of scholars who are broadly interested in 3D related issues. Here, we present a comprehensive review of the current statuses of data, products, methods, and applications for quantifying the vertical dimension of urban landscapes using remote sensing. We further discussed the challenges now facing and future research needed. Specifically, we first reviewed and compared the remote sensing data that could be used to extract the vertical information of urban landscapes, including passive optical data, LiDAR data, SAR data, and street view imagery. We then presented a detailed list of the digital surface model (DSM) and ground object height products derived from remotely sensed data that are readily used for quantifying the vertical structure of urban landscapes, ranging from global-scale products to local ones with finer resolution. We also reviewed key approaches for urban vertical structure analysis, which included urban land cover classification, analysis of the vertical structure of urban architectures, greenspace, and comprehensive landscapes, as well as analysis of the dynamics of urban vertical structure. Additionally, we synthesized applications of urban vertical structure in six core fields: urban heat islands and microclimates, disaster risks, biodiversity, energy and resource consumption, human settlements and social equity, and urban management and planning. Finally, we discussed current challenges and future opportunities, such as limitations and tradeoffs of remote sensing technologies for vertical analysis, extracting vertical information by fusing multi-source remote sensing data, deep learning for high-resolution and high-quality DSM generation, establishing a comprehensive index system for urban vertical structure quantification, monitoring the dynamics of 3D urban landscapes based on long-time-series data, exploring the human perception of 3D urban landscapes, and addressing uncertainty and robustness. To our knowledge, this paper is the first work that comprehensively integrates these elements around the urban vertical structure. It provides abundant information on the quantification of the vertical structure of urban landscapes using remote sensing and offers valuable insights for the remote sensing and 3D research community.
The Green View Index is closely associated with residents' visual perception, significantly impacting both psychological well-being and physical health. Light Detection and Ranging (LiDAR) point clouds offer rich 3D structural data for accurate GVI estimation, but existing methods suffer from low computational efficiency. This study presents a novel method - Projected Point Green View Index (PGVI) - that transforms complex 3D voxels into 2D matrices and employs a cascaded spatial-to-semantic integration strategy to calculate GVI. We tested the method in a residential community. PGVI achieved high accuracy (R2 = 0.86 compared to panoramic photoderived GVI) and was approximately 60 times faster than existing LiDAR-based methods. Unlike conventional image-based methods, PGVI can capture and assess visual greenery from any location, height, and viewing angle. With the growing availability of LiDAR data, PGVI offers a practical tool for city-scale, human-centered green space planning and visual environment assessment.
 Yuguo Qian合作论文数80
 Lijian Han (韩立建)合作论文数State Key Laboratory of Urban and Regional Ecology, Research Center for Eco-Environmental Sciences, Chinese Academy of Sciences74
 Weifeng Li (李伟峰)合作论文数Research Centre for Eco-Environmental Sciences, Chinese Academy of Sciences;University of Chinese Academy of Sciences51
 Wenjuan Yu合作论文数39
 Jia Wang (王佳)合作论文数College of Forestry, Northwest A&F University29
 Steward T.A. Pickett合作论文数Cary Institute of Ecosystem Studies29
 Jing Wang (王靖)合作论文数College of Resources and Environmental Sciences, China Agricultural University24
 Weimin Wang合作论文数Shenzhen Ecological and Environmental Monitoring Center of Guangdong Province23
 Zhiyun Ouyang (欧阳志云)合作论文数Research Center for Eco-Environmental Sciences, Chinese Academy of Sciences23
 Zhong Zheng (郑重)合作论文数Laboratory of Chemical Biology, Chanpchun Institute of Applied Chemistry, Chinese Academy of Sciences19
 Jingli Yan (颜景理)合作论文数School of Agriculture and Biology, Shanghai Jiao Tong University17
 Mary Cadenasso合作论文数Institute of Ecosystem Studies16
 Shixin Wang (王世新)合作论文数Institute of Remote Sensing Applications, Chinese Academy of Sciences;University of Chinese Academy of Sciences14
 Xiaoke Wang (王效科)合作论文数State Key Laboratory of Regional and Urban Ecology, Research Center for Eco-Environmental Sciences, Chinese Academy of Sciences13
 Chuanbao Jing合作论文数12
 Xiuling Zhao合作论文数School of Life Sciences, University of Science and Technology of China11
 Ganlin Huang (黄甘霖)合作论文数School of Natural Resources, Faculty of Geographical Science, Beijing Normal University11
 Lixiao Ma合作论文数10
 Jie Cao (曹杰)合作论文数Department of Atmospheric Sciences, School of Earth Science, Yunnan University10
 Timon Mcphearson合作论文数Environmental Studies Department, College of Arts & Science, New York University;Climasens;Stockholm Resilience Centre10
 Morgan Grove合作论文数Northern Research Station, Forest Service, U.S. Department of Agriculture10
 Austin Troy合作论文数University of Colorado Denver10Yang Yao合作论文数9Min Jiao合作论文数9
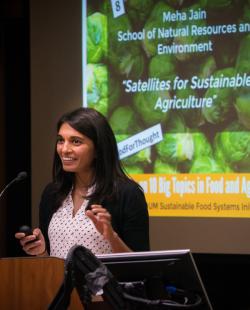 Meha Jain合作论文数School for Environment and Sustainability, University of Michigan-Ann Arbor9
 Xiaofang Hu (胡小方)合作论文数Department of Modern Mechanics, University of Science and Technology of China9
 Hua Zheng (郑华)合作论文数Research Center for Eco-Environmental Sciences, Chinese Academy of Sciences;Institute of Urban Environment, Chinese Academy of Sciences8
 Haiming Qin合作论文数Key Laboratory of Digital Earth Science, Institute of Remote Sensing and Digital Earth, Chinese Academy of Sciences, Beijing 100094, China7
 Shilin Xie合作论文数7Sun Xu合作论文数7
 Yunyu Tian合作论文数Laboratory of Geo-information Science and Remote Sensing, Wageningen University & Research6
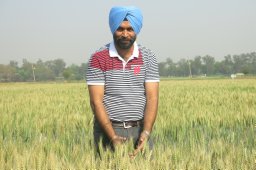 Balwinder-Singh合作论文数International Maize and Wheat Improvement Centre (CIMMYT),, National Agricultural Science Centre Complex (NASC)6
 Zhaowu Yu (余兆武)合作论文数Department of Environmental Science and Engineering, Fudan University6
 Zhiming Zhang (张志明)合作论文数School of Ecology and Environmental Science, Yunnan University6Litao Wang (王丽涛)合作论文数Aerospace Information Research Institute, Chinese Academy of Sciences6
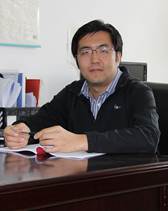 Fei Lu (逯非)合作论文数Research Center for Eco-Environmental Sciences, Chinese Academy of Sciences;University of Chinese Academy of Sciences6Elizabeth M. Cook合作论文数5Zhou Yi合作论文数5Xiaorui Tan合作论文数5
 Chaobin Yang合作论文数Research Center for Eco-Environmental Sciences, Chinese Academy of Sciences5
 Hongxing Zhang合作论文数5WenHui Zhao (赵文慧)合作论文数5
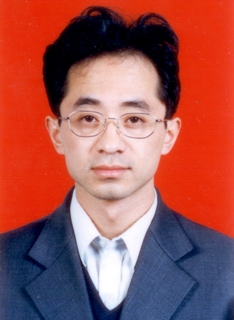 Fuli Yan (阎福礼)合作论文数Aerospace Information Research Institute , Chinese Academy of Sciences;University of Chinese Academy of Sciences5
 Keming Ma (马克明)合作论文数Research Center for Eco-Environmental Sciences, Chinese Academy of Sciences;University of Chinese Academy of Sciences5
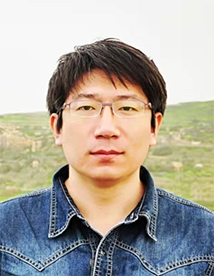 Chi Xu (徐驰)合作论文数School of Life Sciences, Nanjing University5
 Weihua Xu (徐卫华)合作论文数State Key Laboratory of Regional and Urban Ecology, Research Center for Eco-Environmental Sciences, Chinese Academy of Sciences;University of Chinese Academy of Sciences5
 Zhimin Su (苏芝敏)合作论文数5Yufen Ren (任玉芬)合作论文数5




