—Graph convolutional network (GCN) has attracted much attention in the field of hyperspectral image classification for its excellent feature representation and convolution on arbitrarily structured non-Euclidean data. However, most state-of-the-art methods build a graph utilize the distance measure, which makes it challenging to fully characterize the complex relationship of hyperspectral remote sensing data. Moreover, the hyperspectral image usually has uncertainty introduced by the problems of the spectral variability and noise interference. This article uses fuzzy theory to optimize the GCN and thus solve the uncertainty problem in hyperspectral images, and presents a novel fuzzy graph convolutional network (F-GCN) for hyperspectral image classification. By calculating the fuzzy similarity of samples, a robust graph is first built rather than using the traditional Euclidean distance method, which allows a better representation of the complex relationship between hyperspectral remote sensing data. Furthermore, the proposed network introduces fuzzy layers into the model to cope with the ambiguity of the hyperspectral image. Finally, the classification results for three real-world hyperspectral data sets to show its feasibility and effectiveness in hyperspectral image classification.
Based on centimeter-level ultra-high-resolution UAV images, the drifting velocity of floating macroalgae are quantified. In this study, a Large Scale Particle Image Velocimetry (LSPIV) method is used for analyzing the drift of floating macroalgae in high-resolution Red-Green-Blue (RGB) images and videos collected from an unmanned aerial vehicles (UAVs) of hovering mode. The method employs Maximum Cross-Correlation (MCC) and Iterative Multigrid Approach (IMA) to achieve high spatial resolution and wide range of velocity gradient. Utilizing floating macroalgae as natural tracers, we enhance tracer signals using the Red-Green band virtual baseline Floating green Algae Height (RGFAH) index. Subsequently, LSPIV and a deep learning U-Net model are employed to acquire high spatiotemporal resolution information regarding the distribution and drift velocity of floating macroalgae. We then establish comprehensive instantaneous and time-averaged flow fields of floating macroalgae. Utilizing input data derived from alterations in water surface grayscale due to natural tracers such as water surface bubbles, suspended sediment, waves, and sun glint, we analyze the periodic variations in the sea surface velocity and wave intensity correlation based on statistical and Fourier analysis in instantaneous and time-averaged flow fields.
Total suspended solids (TSS) can be a useful indicator of environmental change in nearshore coastal environments. Understanding the mechanisms of TSS variations in response to environmental drivers is of broad interest for ecology and geomorphology. The Yellow River Delta (YRD) in China is a fragile coastal region that has been affected by human activities and climate change. Here, we investigated TSS along the YRD shoreline over two decades with time‐series satellite data (2002–2020). We observed that TSS concentration decreased significantly in nearshore waters (5‐m isobath) surrounding the YRD, especially in the LaiZhou Bay. During the same time period, wave height (WH) along the deltaic shoreline and sediment load from the Yellow River have decreased, while sea surface height (SSH) has displayed a positive trend. Our results indicate that WH and SSH play a major role in sediment resuspension and dispersion, while the YSD mildly affected TSS variability along the coast. Monthly bed shear stress triggered by waves was then computed using WH, wave period (WP), and SSH. Bed shear stress and TSS displayed a positive correlation. We concluded that seasonal oscillations in SSH in conjunction with wind waves are responsible for TSS variability in the shallow waters in front of the YRD.
Since the first report in 2008, macroalgal blooms of Ulva prolifera (often called green tides) in the Yellow Sea have occurred every year, with their origins, transport pathways, temporal changes, as well as causes and consequences studied extensively. Of these studies, satellite remote sensing has been used widely to detect the bloom presence and quantify the bloom size (i.e., U. prolifera coverage in km2 or biomass in kilotons). However, substantial variability has been found in the refereed literature in the remote sensing methodology, results, and interpretation of the U. prolifera coverage, especially in the attempts to study inter-annual changes or long-term trends. There are often inconsistent or contradicting results even from the same satellite sensor. Such inconsistencies or contradictions create difficulty not only within the remote sensing community when presenting new methodology or results, but also to researchers when attempting to use the remote sensing results to make predictions or perform impact assessments. Here, we review the literature on the remote sensing methodology to detect and quantify U. prolifera blooms, and make recommendations based on physical principles. Specifically, we propose the following conceptual guidelines: 1) a reliable index or algorithm should be relatively tolerant to perturbations by non-optimal observing conditions (thick aerosols, thin clouds, moderate sun glint, cloud-adjacent straylight, which can all be found frequently in the study region) for presence/absence detection, as well as to small errors in the selected thresholds to quantify U. prolifera; 2) a reliable index or algorithm should also make it relatively easy to account for variability in subpixel coverage of U. prolifera (i.e., through pixel unmixing) in order to obtain an accurate estimate of total U. prolifera coverage from an image; 3) a reliable data product (i.e., U. prolifera maps) should be able to account for the variable clouds when interpreting spatial patterns or temporal changes, with uncertainty estimates provided whenever possible; and 4) both the algorithm and the data product should minimize manual work in order to make them more objective and repeatable by other researchers. Finally, we show different types of time series of U. prolifera amounts in the Yellow Sea using the approaches based on these guidelines and Moderate Resolution Imaging Spectroradiometer (MODIS) observations, and discuss their implications on the interpretation of annual changes in interdisciplinary studies.
æµ·æ´ä¸å·Cï¼HY-1Cï¼å«ææè½½ç海岸带æå仪CZIï¼Coastal Zone Imagerï¼å¹¿æ³åºç¨äºä¸å½è¿æµ·çæç¾å®³çæµãæ¬ç 究以16 må辨ççé«åå å·WFVï¼Wide Field of Viewï¼å½±åæåç绿潮è¦çé¢ç§¯ä½ä¸ºåèå¼ï¼ä»ç»¿æ½®æ¼æ£çåè¦çé¢ç§¯å®éè¯ä¼°äºCZIå½±åç绿潮çæµè½åï¼å¹¶ä¸250 må辨ççMODISæåç»æè¿è¡äºå¯¹æ¯åæãç»æ表æï¼CZIå½±åç绿潮平åæ¼æ£çåªæMODISå½±åç1/5å·¦å³ï¼ç»¿æ½®è¦çé¢ç§¯æ¯MODISå½±åå°50%以ä¸ãMODISåCZIå½±åç绿潮è¦çé¢ç§¯å线æ§ç¸å ³ï¼å°MODISå½±åç绿潮è¦çé¢ç§¯è½¬æ¢ä¸ºCZIç»æï¼è¯¥ç»ææ¾ç¤ºï¼2019å¹´ã2021年度绿潮æ大è¦çé¢ç§¯ä¸º2000 km²左å³ï¼æ¯2020å¹´åæç6åå·¦å³ãå¨ç»¿æ½®çæµæ¹é¢ï¼ç¸æ¯äºMODISï¼CZIå½±åç绿潮æ¼æ£çè¾ä½ä¸è¦çé¢ç§¯æ´æ¥è¿çå®åèå¼ãæ¬ç 究建ç«äºCZIä¸ç®åè¾å¸¸ç¨çMODIS绿潮è¦çé¢ç§¯ç转æ¢å ³ç³»ï¼å¯å¼¥è¡¥CZIè§æµé¢æ¬¡ç缺é·ï¼è¿èå®ç°ç»¿æ½®é«é¢æ¬¡è§æµã
绿潮çç©éæ¯ç²¾åéåæµ·æ´å¤§åæ¼æµ®è»ç±»çå ³é®åæ°ï¼æ¯åæ æµ·æ´çæç¯å¢ååçææææ ãå«æé¥æææ¯æ¯ä¸å½è¿æµ·ç»¿æ½®çæµçææææ¯æ¯æï¼å å¦é¥æå«æè½ä¸ºç»¿æ½®çç²¾ç»åå®éçæµä¸è¯ä¼°æä¾æ°æ®æ¯æï¼è½å®ç°ç»¿æ½®çç²¾åè¯å«ä¸éåä¼°ç®ãé对ä¸å½æµ·æ´ä¸å·C/Då«æ ï¼Haiyang-1C/Dï¼ HY-1C/Dï¼ æµ·å²¸å¸¦æå仪 ï¼Coastal Zone Imagerï¼ CZIï¼ ãç¾å½ä¸å辨çæåå 谱仪 ï¼Moderate-resolution Imaging Spectroradiometerï¼ MODISï¼ã欧洲空é´å±å¨å µ2å·å«æå¤å è°±æå仪 ï¼Multi Spectral Instrumentï¼MSIï¼çå å¦é¥ææ°æ®ç¹ç¹ï¼åºäºç»¿æ½®çç©éåå模æä¸è§æµéªè¯æ°æ®ï¼æ¬ç 究æåºäºéç¨äºä¸åå å¦å«ææ°æ®ç绿潮çç©éä¼°ç®æ¨¡åä¸è®¡ç®æ¹æ³ï¼å¼å±äºä¸å½è¿æµ·ç»¿æ½®çç©éå å¦é¥æä¼°ç®æ¹æ³ç 究ä¸äº¤åéªè¯ãç»æ表æï¼ç¸è¾äºç»¿æ½®åå é¢ç§¯åè¦çé¢ç§¯ï¼ç»¿æ½®çç©éä¼°ç®ç»æçä¸ç¡®å®æ§æå°ï¼è¯¥åæ°è½ææåå°é¢ç§¯åæ°æå å«ç尺度æåºå·®å¼ï¼è½æ´åç¡®å°ç¨äºæµ·æ´ç»¿æ½®çéåä¸è¯ä¼°ãæ¤å¤ï¼åºäºCZIåMODISæ°æ®å¼å±2021å¹´ä¸å½è¿æµ·ç»¿æ½®çç©éååçæµåºç¨ï¼æææé«äºç»¿æ½®çç©éçæµç精度ï¼è¯¦ç»éåäº2021å¹´ä¸å½è¿æµ·ç»¿æ½®çç©éçå¹´å ååï¼å±ç°äºç»¿æ½®çç©éçç²¾ç»ç©ºé´åå¸æ ¼å±ä¸ååè¶å¿ãå¤æºå å¦é¥ææ°æ®å¼å±ç»¿æ½®çç©éé¥æä¼°ç®ï¼å¯¹ä¸å½è¿æµ·æ¼æµ®è»ç±»çç²¾åãå®éãå¨æçæµï¼å ·æéè¦çæ¹æ³ä¸æ°æ®åèæä¹ã
Marine oil snow (MOS) potentially forms after an oil spill. To fully understand the mechanism of its formation, we investigated the effects of suspended particles (SP) and dispersants on MOS formation of crude oil and diesel oil by laboratory experiments. In the crude oil experiment, the SP concentration of 0.2 g L–1 was more suitable for crude oil MOS formation. The addition of dispersants significantly stimulated N and TV during MS/MOS formation of SP at 0.4 g L–1 and 0.8 g L–1 concentration (p < 0.05). Without SP, the dispersants also stimulated crude oil MOS formation. Furthermore, the concentration of SP had a significantly positive effect on the reduction of the total amount of N-alkanes (p < 0.05). In the diesel oil experiment, after adding dispersants to diesel oil, the maximum N, Dm, and TV values at a SP concentration of 0.2 g L–1 were significantly higher than those at 0.4 g L–1 and 0.8 g L–1 (p < 0.05). Besides, we found that dispersants stimulated MOS formation in diesel oil at a SP concentration of 0.2 g L–1. However, the dispersants had an inhibitory effect on diesel oil MOS formation without SP. Notably, the MOS formed by diesel oil appeared white, unlike the black MOS associated with crude oil. These findings are important for the environmental impact of oil spills and elevated SP concentrations.
Four short sediment cores were collected to explore the impacts of bay scallop farming on the composition and accumulation of sedimentary organic matter (SOM). The results revealed that SOM was mainly composed of relatively easily biodegradable substances as evidenced by the high contribution rate of biopolymeric carbon (77.8–94.4%). The sediment accumulation rate in the scallop farming area (SFA) was 28.6% higher than that in the non-scallop farming area (NSFA). The total organic carbon (TOC) and total nitrogen (TN) burial fluxes in the SFA were 33.1 and 36.6% higher than those in the NSFA, respectively. A rough estimate showed that the burial fluxes of TOC, TN, scallop-derived OC, and marine algal-derived OC in the ~150 km2 SFA could increase by 1.08, 0.11, 0.39, and 0.68 g m−2 yr−1, respectively, with annual scallop production increasing 104 t. This study highlights the significant effects of scallop farming on the biogeochemistry of SOM in coastal waters, which provides a direct reference for future research on the carbon cycle in shellfish culture areas.
Ulva prolifera and Sargassum are two common floating macroalgae in China’s coastal algal bloom events. Ulva prolifera frequently emerges concomitantly with Sargassum outbreaks, thereby presenting challenges to the monitoring of algal blooms, thereby presenting challenges to the monitoring of algae. To tackle the challenge of differentiating between Ulva prolifera and Sargassum, this study employs Sentinel-2 MSI data for spectral analysis. Notably, significant disparities in the Remote Top of Atmosphere Reflectance (Rtoa) between Ulva prolifera and Sargassum are observed. This study proposes a random forest-based algorithm for discriminating between Ulva prolifera and Sargassum in the regions of the Yellow Sea and East China Sea. The algorithm introduced in this study attains remarkable accuracy in distinguishing Ulva prolifera and Sargassum within Sentinel-2 MSI data, achieving identical F1 scores of 99.1% for both. Moreover, when tested with GF-1 WFV data, the algorithm showcases outstanding performance; this demonstrates the algorithm’s robustness and its ability to mitigate the uncertainty linked to threshold selection. Simultaneously, a comparative analysis of algae distribution was conducted for both 2017 and the period from January to May 2023. Experimental results indicate that the algorithm exhibits high accuracy in distinguishing between Ulva prolifera and Sargassum. This capability will significantly enhance the monitoring of large algae in maritime regions; this holds crucial theoretical significance and offers substantial practical value in the realm of marine ecological conservation.
é¥ææ¯æµ·è¡¨æ¼æµ®å¤§åè»çæµçéè¦æ段ãæ¬ç 究åºäºæ 人æºãé«å辨çå«æï¼Sentinel-2 MSIãGF-6 WVFãHY-1C/D CZIï¼è·åç3ç»å对ï¼å¯¹ä¸å尺度çé»æµ·æ¼æµ®å¤§åè»æµèæååå ¶ç²¾ç»åè¿ç§»è¿ç¨è¿è¡äºè§æµãå ¶ä¸ï¼åºäºHY-1C/Dåæç»ç½å®ç°äº2.45 hå 50 må辨ç级å«çæåç¹å¯¹ç¹è·è¸ªï¼å¨è§æµæ¶æ®µï¼é£ä¸æµ·æ´æ½®æµçæ¹åè¾ä¸ºä¸è´ï¼äºè æåºå å ï¼ä½¿å¾æµèçè¿ç§»é度ç¸å¯¹è¾é«ï¼å¹³åè¿ç§»é度为0.380 m/sãå¨10 m级å辨ççMSIãWVFå½±åä¸ï¼æµèæåçæ°´å¢éé¢æè¾èåºå¨ä¸åè§æµè§ä¸ï¼ä¼å¯¼è´æ´å¤ææ´å°çå ¥ç³å¤ªé³èå åç°åºäº®ãæçåºåç±å¤ªé³èå å¼å¸¸è¡¨å¾çè¿ç±»è¾èåºå¨è¿30 minå æç»åå¨ï¼ä¸åçäºææ¾è¿ç§»ï¼å ¶å¹³åé度约为0.2 m/sãåºäºåç±³çº§è¶ é«å辨çæ 人æºå¾åå¯å®ç°ç§çº§è³åé级å«çæ¼æµ®å¤§åè»è¿ç§»è§æµï¼å¹³åé度为0.066 m/sï¼å°æåæµèåé£çå½±åï¼æ²¿é£ååé¾æ¡ç¶åå¸ç¹å¾ï¼ä¸¤è 夹è§å°äº15°ãç»ææ¾ç¤ºï¼æµèæåå¤åæ¡ç¶ï¼å ¶å»¶ä¼¸æ¹åå¨ä¸å尺度ä¸è¡¨ç°åºä¸é£åçä¸è´æ§ï¼æ¾ç¤ºåºé£å¯¹æµèæåè¿ç§»çå½±åï¼åºäºå¤ªé³æµ·è¡¨èå 表å¾çæµ·æµè¾èåºåæµèæåç空é´ä½ç½®ååï¼ä½ç°äºæµ·æµå¨åè¿ç¨å¯¹æµèè¿ç§»çå½±åãæ¬ç 究æ¾ç¤ºï¼éè¿é«æ¶ç©ºå辨ççå å¦å对å¯å¯¹æµ·è¡¨æ¼æµ®å¤§åè»çè¿ç§»ç²¾åè§æµï¼å¯æç¨äºå ¶è¿ç§»ç©çå¨åæºå¶çç 究ã
大型海藻养殖的时空动态变化监测对其环境管理至关重要,目前关于不同品种的大型海藻养殖的对比监测鲜有研究报道.文章基于Sentinel-2 卫星影像,利用归一化植被指数(normalized difference vegetation index,NDVI)与支持向量机(support vector machine,SVM),对山东省威海市文登区南部海域紫菜养殖区与荣成市南部海域海带养殖区的动态特征进行了监测.研究结果表明:①威海市文登区的紫菜养殖在2016 年遥感影像上首次出现,与该市历史上首次出现紫菜养殖的年份相符;基于文章方法提取的紫菜养殖区与海带养殖区的整体提取效果较好,总体精度可达84%以上;②2017-2021 年度紫菜养殖区的遥感监测面积整体呈逐年增加趋势,空间上养殖区呈现远离岸边的分布趋势;③紫菜与海带养殖区监测面积总体呈冬高、夏低的冷水型藻类养殖季节变化特征,但紫菜养殖区监测面积最小值与最大值出现时间较海带养殖区早1~2 个月.卫星遥感较统计年鉴能提供更精确的时间与空间信息,研究可为中国北方海岸带大型海藻养殖管理提供监测技术与数据上的参考与借鉴.
Knowing how much measurement noise is in a signal is critical for evaluating the overall performance of a satellite observation. We developed a triple collocation observation (TCO) algorithm for estimating measurement noise by collocation comparing the local deviations of three satellite data sets. When we evaluated our algorithm with a synthetic data set, the results showed that the algorithm effectively derived measurement noise from satellite signals despite the many intermission signal differences among the satellites. The TCO algorithm produced <6.66% uncertainty in the measurement noise estimates that we derived from the synthetic data set. In addition, to maximally isolate measurement noise from ocean color images, we developed a set of data quality control criteria to apply when identifying synchronous pixel pairs. Using images from the Medium Resolution Spectral Imager II (MERSI II), the Visible Infrared Imaging Radiometer Suite (VIIRS), and the Moderate Resolution Imaging Spectroradiometer (MODIS) instruments, we applied our data quality control criteria and found that the TCO algorithm produced measurement noise consistent with the measured prelaunch or specifications for VIIRS and MERSI II instrument noise. However, the TCO measurement noise was significantly lower than the spaced MODIS noise because MODIS’s extended service time likely produced instrument degradation. Overall, MODIS performed better than MERSI II but worse than VIIRS. Furthermore, we found that the residual error in remote sensing reflectance exponentially decreased as the measurement signal-to-noise ratio (MSNR) increased. Because of this exponential relationship, the MSNR should not be lower than 181 to achieve the <5% uncertainty goal of remote sensing reflectance at 443 nm that NASA proposed. Our results suggest that the TCO algorithm is an effective approach for comprehensively estimating and comparing instrument performance.
针对目前卫星遥感中夜光藻赤潮识别精度低、实时性差的问题,提出一种基于深度学习的无人机(UAV)影像夜光藻赤潮提取方法.首先,以UAV采集的高分辨率夜光藻赤潮RGB视频影像作为监测数据,在原有UNet++网络基础上,通过修改主干模型为VGG-16,并引入空间dropout策略,分别增强了特征提取能力并防止过拟合;然后,使用ImageNet数据集预先训练的VGG-16网络进行迁移学习,以提高网络收敛速度;最后,为评估所提方法的性能,在自建的赤潮数据集Redtide-DB上进行实验.所提方法的夜光藻赤潮提取总体精度(OA)为94.63%,F1评分为0.9552,Kappa为0.9496,优于K近邻(KNN)、支持向量机(SVM)和随机森林(RF)这3种机器学习方法及3种典型语义分割网络(PSPNet、SegNet和U-Net).在模型泛化能力测试中,所提方法对不同拍摄设备和拍摄环境的夜光藻赤潮影像表现出一定泛化能力,OA为97.41%,F1评分为0.9659,Kappa为0.9382.实验结果表明,所提方法可以实现夜光藻赤潮自动化、高精度的提取,可为夜光藻赤潮监测和研究工作提供参考.
The presence of clouds interferes with optical remote sensing monitoring of macroalgae blooms. To solve this problem, we propose a simple method for estimating macroalgae area under clouds (Area_cloud_GT) on MODIS imagery using the principle behind the lowpass filter. The method is based on a rectangle with clouds and eight identical adjacent rectangles surrounding it that contain macroalgae. The cloud rectangle is a central ‘pixel’ (Cloud) and the eight adjacent rectangles are ‘pixels’ GT1–GT8. The core operation is to calculate the central ‘pixel’ value, i.e., the macroalgae coverage rate in the Cloud rectangle. The macroalgae area detected by semi-simultaneous fine resolution images in the same region was taken as the ‘real’ value. A comparison of the estimation results and the ‘real’ value shown that the mean relative difference between them (MRD) was 30.09% when the time interval of the images within 10 minutes. When the time interval was over 3 hours, the MRD was more than 60%. The MRD increased significantly with increasing time interval because of the constant movement of the macroalgae and the limitations of the remote sensing image. The results indicate that this simple method is effective to a certain extent. These results can provide a reference for the quantitative analysis of green tide.
卫星影像是监测海面漂浮绿藻的重要数据源,但是混合像元的存在使得绿藻提取存在一定的误差.想要实现近海区域底栖绿藻的精细监测,需要解决绿藻亚像素覆盖度的问题.本文以厘米级分辨率无人机数据的绿藻提取结果为基准,通过分析Landsat卫星影像绿藻光谱,建立绿藻亚像素覆盖度与多种植被指数和多个特征波段反射率的反演模型.结果表明,蓝、绿、红波段反射率与绿藻亚像素覆盖度呈现较好的线性关系,随着绿藻亚像素覆盖度递增,蓝、绿、红波段反射率的值均递减.将蓝、绿、红波段的三种绿藻亚像素覆盖模型进行验证,发现绿波段反射率所建立的反演模型具有更高的准确性,决定系数、均方根误差、平均相对误差分别为0.92%、0.07%、10.85%.本文所建立的模型可以估算大型绿藻亚像素覆盖度,实现Landsat卫星影像对大型绿藻的精细监测.
水产养殖是人类获取食品的重要途径,养殖池塘是水产养殖的主要生产方式之一.珠江三角洲是我国南方重要的渔业养殖基地,在过去30 a间,其空间分布发生巨大变化.本研究面向中山市及其邻近区域,基于Landsat和Sentinel-2卫星遥感数据,使用线性混合像元分解方法进行混合像元分解,通过目视对比分析,选取了70%及以上水体丰度对应的归一化水体指数阈值范围,获取了1990—2021年典型养殖池塘的时空分布.研究结果显示,中山市及邻近区域的养殖池塘在1990年以来经历了先增加后减少的过程;中山市及邻近区域1990—2000年养殖池塘面积增加了近一倍,2000—2010年相对平稳,2010—2021年养殖面积则减少了近50%.本研究可减少混合像元对于养殖池塘监测的影响并为大湾区渔业科学养殖与可持续发展提供参考.
Video surveillance is an important method to obtain the dynamic changes of green macroalgae along the coast. The paper proposes a coastal green macroalgae extraction method based on the SLIC superpixel segmentation, CNN and SVM to realize the automated recognition of green macroalgae from lots of high-resolution RGB video data collected by unmanned aerial vehicle (UAV) and handheld devices. Firstly, SLIC algorithm is used to generate the multi-scale patches on the original high-resolution image. Then, three classification CNN is used to divide the multi-scale patches into three types: green macroalgae, background and mixing. Finally, SVM algorithm is used to extract the green macroalgae to improve the accuracy at the pixel level in the mixed patches. In order to evaluate the performance of the proposed method, experiments are conducted on our coastal green macroalgae image dataset. Compared with the method of RGB vegetation indices (such as ExR, RGBVI, NGBDI), the overall accuracy (OA), F1 score, and Kappa of the green macroalgae extraction with the method proposed in this paper are up to 95.23%, 0.9612, 0.9436, respectively. The results show that our method is significantly better than that of RGB vegetation indices since it effectively reduces the influence of sea waves and light on the recognition results. The automated extraction method for coastal green macroalgae proposed in this paper can provide a reference for the automatic monitoring of coastal green macroalgae with high precision.
以粤港澳大湾区中山市及其邻近水域河网水体为试验区,同步采集现场光谱及水质数据,研究受测水体的高光谱反射率特征,并分析非光学活性参数中化学需氧量(CODCr)、总磷(TP)浓度与高光谱反射率的相关性.结果显示,各河流水体光谱反射率主要受悬浮颗粒物和叶绿素a的影响;在500~680nm波段范围内,水体光谱反射率大小与CODCr、TP浓度呈负相关关系;与单波段相比,特定波段的反射率比值与CODCr、TP浓度值的相关性较高,与CODCr、TP浓度值相关性最高的反射率比值波段组合分别为R675/R794、R690/R815.选择上述波段组合建立的水质反演模型具有良好的估算精度,模型估算平均相对误差分别为27.2%、32.1%,表明高光谱技术在珠江口河网水体非光学活性参数CODCr、TP浓度反演上具有较大的应用潜景.
连云港海域的紫菜养殖遥感监测对于规划紫菜养殖空间分布具有重要意义.基于50 m空间分辨率的"海洋一号C"卫星(HY-1C)海岸带成像仪(coastal zone imager,CZI)数据,利用归一化植被指数(NDVI)和人工目视解译,获取了2018年10月—2020年4月连云港沿岸的紫菜养殖遥感监测面积,并分析了紫菜养殖的季节变化特征.结果显示,连云港紫菜养殖区主要分布于海州湾和连岛附近海域;养殖区自9月至次年5月在CZI图像上可见,紫菜养殖遥感监测面积呈先增加后减少的趋势,1—2月其遥感监测面积通常达到一个养殖周期的最大值,3月初面积迅速减少;基于CZI影像的2019年度遥感监测面积为123 km2,2020年度为160 km2.建立HY-1C与哨兵二号(10 m)、高分一号(16 m)和Landsat-8(30 m)监测结果的线性模型,以Google Earth影像目视解译的紫菜养殖区遥感面积作为真实值,并将哨兵二号监测值转换为真实值.换算成真实值的2020年度紫菜养殖区真实面积为94 km2,较2015年度的42 km2增长了1倍多.研究展示CZI可用于紫菜养殖区的业务化观测.建议利用其1—2月份的多期遥感影像监测结果作为年度紫菜养殖区遥感监测面积的基准.
为研究珠江口城市河流水体高光谱特征与城市河流水质指数(CWQI)的关系,对中山市典型河流开展了高光谱监测和同步水质分析,基于偏最小二乘回归(PLSR)建立了高光谱数据与CWQI的反演模型,并研究了反演模型的最佳光谱分辨率和最优主成分数.结果 表明:基于化学需氧量、总磷、氨氮和溶解氧4项水质指标质量浓度值计算得到的CWQI值可较好地反映研究区河流水质状况;水体不同波段的光谱反射率与CWQI存在一定的相关性,可用于区分不同CWQI的水体;光谱分辨率为50 nm、提取主成分数为8时的反演模型效果最优,验证集均方根误差和平均相对误差分别为0.768和18.1%.将该反演模型与无人机高光谱监测数据结合,可较好地反映河流水质的空间差异.
 Ping Shi (施平)合作论文数State Key Laboratory of Tropical Oceanography, South China Sea Institute of Oceanology, Chinese Academy of Sciences29
 Dingfeng Yu合作论文数Qilu Univ Technol, Inst Oceanog Instrumentat, Shandong Acad Sci, Qingdao 266061, Peoples R China15
 mingjing lou合作论文数12
 Xiangyang Zheng合作论文数9
 Chuqun Chen (陈楚群)合作论文数9Wandong Ma合作论文数8
 Xuelu Gao (高学鲁)合作论文数Yantai Institute of Coastal Zone Research, Chinese Academy of Sciences7
 Hailong Liu (刘海龙)合作论文数Department of Atmospheric Sciences, School of Earth Sciences, Yunnan University7
 Xin Liu (刘欣)合作论文数中国科学院大学中国科学院烟台海岸带可持续发展研究所6Heyin Shi合作论文数5Jinghu Li合作论文数5lei bing合作论文数5
 Deyu An合作论文数5
 Mengquan wu合作论文数5
 Yuanzhi Zhang (张渊智)合作论文数School of Marine Sciences, Nanjing University of Information Science and Technology5Luigi Tosi合作论文数National Research Council (CNR) Institute of Marine Sciences (ISMAR) San Polo5ruolin meng (孟若琳)合作论文数4
 Federica Braga合作论文数4
 Qiwei Sun合作论文数4YaLong Liu (刘亚龙)合作论文数4
 Shouzhen Liang (梁守真)合作论文数4Shilin Tang (唐世林)合作论文数South China Sea Institute of Oceanology, Chinese Academy of Sciences4
 Chunli Liu (刘春利)合作论文数Marine College, Shandong University4Shoujing Yin合作论文数4
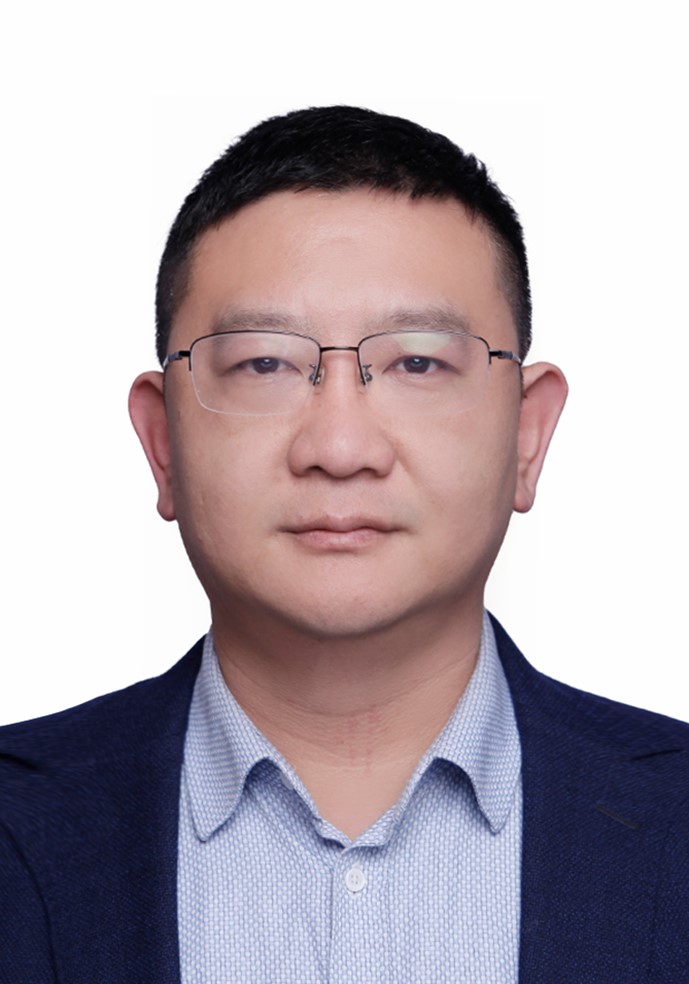 Yingcheng Lu (陆应诚)合作论文数International Institute for Earth System Science, Nanjing University4Deheng Zhao合作论文数3
 Guangzong Zhang合作论文数3
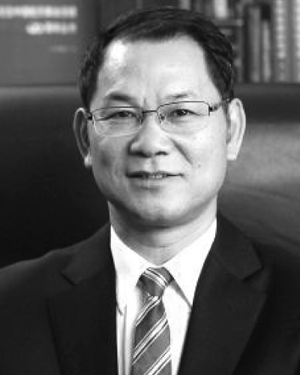 Jianqiang Liu合作论文数Natl Satellite Ocean Applicat Serv, Beijing 100081, Peoples R China3
 Yanlong Chen (陈艳拢)合作论文数National Marine Environmental Monitoring Center3
 Sufen Wang合作论文数3
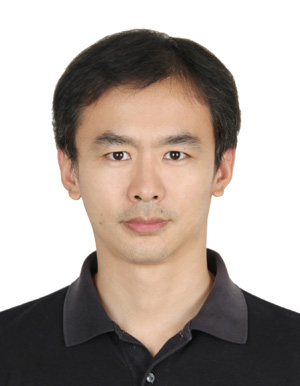 Cheng Tang (唐诚)合作论文数中国科学院大学中国科学院烟台海岸带可持续发展研究所3
 Lin Li (李琳)合作论文数Research Center for Eco-Envlronmental Sciences, Chinese Academy of Sciences3Jiannan Cai合作论文数3
 Xuerong Li合作论文数3
 Chuanmin Hu合作论文数College of Marine Science, University of South Florida3
 Dongyan Liu (刘东艳)合作论文数State Key Laboratory of Estuarine and Coastal Research, East China Normal University3
 Zhenlin Liang (梁振林)合作论文数Marine College, Shandong University, Weihai3
 Xiaodong Song合作论文数3
 Liqiao Tian (田礼乔)合作论文数State Key Laboratory of Information Engineering in Surveying, Mapping and Remote Sensing, Wuhan University3
 Chuanqing Wu (吴传清)合作论文数Economics and Management School, Wuhan University;China Institute for Main Function Area Strategy, Wuhan University3Lixin Zhu合作论文数3
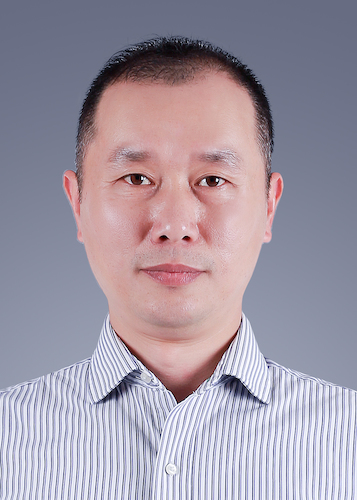 Bin Zhou (周斌)合作论文数School of Information Science and Technology, Hangzhou Normal University3Liangju Yu (于良巨)合作论文数3
 Danling Tang (唐丹玲)合作论文数State Key Laboratory of Oceanography in the Tropics, South China Sea Institute of Oceanology, Chinese Academy of Sciences;College of Resources and Environment, University of Chinese Academy of Sciences3Tianci Gao合作论文数2Zhenning Wei (魏振宁)合作论文数2Yingzhuo Hou合作论文数2Ruihong Guo合作论文数2MENG Miaomiao (孟苗苗)合作论文数2




