We measured the components of the 31-m-long vector between the two very-long-baseline interferometry (VLBI) antennas at the Kokee Park Geophysical Observatory (KPGO), Hawaii, with approximately 1 mm precision using phase delay observables from dedicated VLBI observations in 2016 and 2018. The two KPGO antennas are the 20 m legacy VLBI antenna and the 12 m VLBI Global Observing System (VGOS) antenna. Independent estimates of the vector between the two antennas were obtained by the National Geodetic Survey (NGS) using standard optical surveys in 2015 and 2018. The uncertainties of the latter survey were 0.3 and 0.7 mm in the horizontal and vertical components of the baseline, respectively. We applied corrections to the measured positions for the varying thermal deformation of the antennas on the different days of the VLBI and survey measurements, which can amount to 1 mm, bringing all results to a common reference temperature. The difference between the VLBI and survey results are 0.2 ± 0.4 mm, −1.3 ± 0.4 mm, and 0.8 ± 0.8 mm in the East, North, and Up topocentric components, respectively. We also estimate that the Up component of the baseline may suffer from systematic errors due to gravitational deformation and uncalibrated instrumental delay variations at the 20 m antenna that may reach ± 10 and −2 mm, respectively, resulting in an accuracy uncertainty on the order of 10 mm for the relative heights of the antennas. Furthermore, possible tilting of the 12 m antenna increases the uncertainties in the differences in the horizontal components to 1.0 mm. These results bring into focus the importance of (1) correcting to a common reference temperature the measurements of the reference points of all geodetic instruments within a site, (2) obtaining measurements of the gravitational deformation of all antennas, and (3) monitoring local motions of the geodetic instruments. These results have significant implications for the accuracy of global reference frames that require accurate local ties between geodetic instruments, such as the International Terrestrial Reference Frame (ITRF).
The next-generation VLBI system called VGOS (VLBI Global Observing System) has been designed and built as a significant improvement over the legacy geodetic VLBI system to meet the accuracy and stability goals set by the Global Geodetic Observing System (GGOS). Improved geodetic products are expected as the VGOS technique transitions from demonstration to operational status, which is underway. Since 2019, a network of nine VGOS stations has been observing bi-weekly under the auspices of the International VLBI Service for Geodesy and Astrometry (IVS) to generate standard geodetic products. These products, together with the mixed-mode VLBI observations that tie the VGOS and legacy networks together will be contributions to the next realization of the International Terrestrial Reference Frame (ITRF2020). Moreover, since 2020 a subset of 2 to 4 VGOS stations has also been observing in a VLBI Intensive-like mode to assess the feasibility of Earth rotation (UT1) estimation using VGOS. Intensives are daily legacy VLBI observations that are run on a daily basis using a single baseline between Kokee Park Geophysical Observatory, Hawaii, and Wettzell Observatory, Germany, made with the goal of near-real-time monitoring of UT1. In this presentation, we will describe the VGOS observations, correlation, post-processing, and preliminary geodetic results, including UT1. We will also compare the VGOS estimates to estimates from legacy VLBI, including estimates from mixed-mode observations, to explore the precision and accuracy of the VGOS products.
Type III solar radio bursts are the Sun’s most intense and frequent nonthermal radio emissions. They involve two critical problems in astrophysics, plasma physics, and space physics: how collective processes produce nonthermal radiation and how magnetic reconnection occurs and changes magnetic energy into kinetic energy. Here magnetic reconnection events are identified definitively in Solar Dynamics Observatory UV-EUV data, with strong upward and downward pairs of jets, current sheets, and cusp-like geometries on top of time-varying magnetic loops, and strong outflows along pairs of open magnetic field lines. Type III bursts imaged by the Murchison Widefield Array and detected by the Learmonth radiospectrograph and STEREO B spacecraft are demonstrated to be in very good temporal and spatial coincidence with specific reconnection events and with bursts of X-rays detected by the RHESSI spacecraft. The reconnection sites are low, near heights of 5–10 Mm. These images and event timings provide the long-desired direct evidence that semi-relativistic electrons energized in magnetic reconnection regions produce type III radio bursts. Not all the observed reconnection events produce X-ray events or coronal or interplanetary type III bursts; thus different special conditions exist for electrons leaving reconnection regions to produce observable radio, EUV, UV, and X-ray bursts.
Low radio frequency solar observations using the Murchison Widefield Array have recently revealed the presence of numerous weak short-lived narrowband emission features, even during moderately quiet solar conditions. These nonthermal features occur at rates of many thousands per hour in the 30.72 MHz observing bandwidth, and hence necessarily require an automated approach for their detection and characterization. Here, we employ continuous wavelet transform using a mother Ricker wavelet for feature detection from the dynamic spectrum. We establish the efficacy of this approach and present the first statistically robust characterization of the properties of these features. In particular, we examine distributions of their peak flux densities, spectral spans, temporal spans, and peak frequencies. We can reliably detect features weaker than 1 SFU, making them, to the best of our knowledge, the weakest bursts reported in literature. The distribution of their peak flux densities follows a power law with an index of −2.23 in the 12–155 SFU range, implying that they can provide an energetically significant contribution to coronal and chromospheric heating. These features typically last for 1–2 s and possess bandwidths of about 4–5 MHz. Their occurrence rate remains fairly flat in the 140–210 MHz frequency range. At the time resolution of the data, they appear as stationary bursts, exhibiting no perceptible frequency drift. These features also appear to ride on a broadband background continuum, hinting at the likelihood of them being weak type-I bursts.
The GGAO 12-m and Westford 18-m antennas are instrumented with the four-band broadband signal chain to provide VGOS capability. These antennas have been making VGOS geodetic observations for more than a year. Preliminary analysis of the thirteen sessions, which range in duration from one to 15 hours, gives a weighted RMS deviation of 2 mm from the mean baseline length (601 km). The 12-m VGOS antenna at Kokee Park Geophysical Observatory on Kauai, HI, was completed in early 2016, and the broadband signal chain, built by MIT Haystack Observatory, was installed. Observations with the GGAO12M and Westford antennas began in February. These will increase in duration from one to 24 hours with completion of the Commissioning Phase for KOKEE12M expected in May 2016.
Context. Low-frequency radio arrays are opening a new window for the study of the sky, both to study new phenomena and to better characterize known source classes. Being flat-spectrum sources, blazars are so far poorly studied at low radio frequencies.Aims. We characterize the spectral properties of the blazar population at low radio frequency, compare the radio and high-energy properties of the gamma-ray blazar population, and search for radio counterparts of unidentified gamma-ray sources.Methods. We cross-correlated the 6100 deg(2) Murchison Widefield Array Commissioning Survey catalogue with the Roma blazar catalogue, the third catalogue of active galactic nuclei detected by Fermi-LAT, and the unidentified members of the entire third catalogue of gamma-ray sources detected by Fermi-LAT. When available, we also added high-frequency radio data from the Australia Telescope 20 GHz catalogue.Results. We find low-frequency counterparts for 186 out of 517 (36%) blazars, 79 out of 174 (45%) gamma-ray blazars, and 8 out of 73 (11%) gamma-ray blazar candidates. The mean low-frequency (120-180 MHz) blazar spectral index is = 0.57 +/- 0.02: blazar spectra are flatter than the rest of the population of low-frequency sources, but are steeper than at similar to GHz frequencies. Low-frequency radio flux density and gamma-ray energy flux display a mildly significant and broadly scattered correlation. Ten unidentified gamma-ray sources have a (probably fortuitous) positional match with low radio frequency sources.Conclusions. Low-frequency radio astronomy provides important information about sources with a flat radio spectrum and high energy. However, the relatively low sensitivity of the present surveys still misses a significant fraction of these objects. Upcoming deeper surveys, such as the GaLactic and Extragalactic All-Sky MWA (GLEAM) survey, will provide further insight into this population.
Detection of the Epoch of Reionization HI signal requires a precise understanding of the intervening galaxies and AGN, both for instrumental calibration and foreground removal. We present a catalogue of 7394 extragalactic sources at 182 MHz detected in the RA=0 field of the Murchison Widefield Array Epoch of Reionization observation programme. Motivated by unprecedented requirements for precision and reliability we develop new methods for source finding and selection. We apply machine learning methods to self-consistently classify the relative reliability of 9490 source candidates. A subset of 7466 are selected based on reliability class and signal-to-noise ratio criteria. These are statistically cross-matched to four other radio surveys using both position and flux density information. We find 7369 sources to have confident matches, including 90 partially resolved sources that split into a total of 192 sub-components. An additional 25 unmatched sources are included as new radio detections. The catalogue sources have a median spectral index of -0.85. Spectral flattening is seen toward lower frequencies with a median of -0.71 predicted at 182 MHz. The astrometric error is 7 arcsec. compared to a 2.3 arcmin. beam FWHM. The resulting catalogue covers approximately 1400 sq. deg. and is complete to approximately 80 mJy within half beam power. This provides the most reliable discrete source sky model available to date in the MWA EoR0 field for precision foreground subtraction.
We present deep polarimetric observations at 154 MHz with the Murchison Widefield Array (MWA), covering 625 deg^2 centered on RA=0 h, Dec=-27 deg. The sensitivity available in our deep observations allows an in-band, frequency-dependent analysis of polarized structure for the first time at long wavelengths. Our analysis suggests that the polarized structures are dominated by intrinsic emission but may also have a foreground Faraday screen component. At these wavelengths, the compactness of the MWA baseline distribution provides excellent snapshot sensitivity to large-scale structure. The observations are sensitive to diffuse polarized emission at 54' resolution with a sensitivity of 5.9 mJy beam^-1 and compact polarized sources at 2.4' resolution with a sensitivity of 2.3 mJy beam^-1 for a subset (400 deg^2) of this field. The sensitivity allows the effect of ionospheric Faraday rotation to be spatially and temporally measured directly from the diffuse polarized background. Our observations reveal large-scale structures ( 1 deg - 8 deg in extent) in linear polarization clearly detectable in 2 minute snapshots, which would remain undetectable by interferometers with minimum baseline lengths >110 m at 154 MHz. The brightness temperature of these structures is on average 4 K in polarized intensity, peaking at 11 K. Rotation measure synthesis reveals that the structures have Faraday depths ranging from -2 rad m^-2 to 10 rad m^-2 with a large fraction peaking at +1 rad m^-2. We estimate a distance of 51+/-20 pc to the polarized emission based on measurements of the in-field pulsar J2330-2005. We detect four extragalactic linearly polarized point sources within the field in our compact source survey. Based on the known polarized source population at 1.4 GHz and non-detections at 154 MHz, we estimate an upper limit on the depolarization ratio of 0.08 from 1.4 GHz to 154 MHz.
In this paper we present observations, simulations, and analysis demonstrating the direct connection between the location of foreground emission on the sky and its location in cosmological power spectra from interferometric redshifted 21 cm experiments. We begin with a heuristic formalism for understanding the mapping of sky coordinates into the cylindrically averaged power spectra measurements used by 21 cm experiments, with a focus on the effects of the instrument beam response and the associated sidelobes. We then demonstrate this mapping by analyzing power spectra with both simulated and observed data from the Murchison Widefield Array. We find that removing a foreground model which includes sources in both the main field-of-view and the first sidelobes reduces the contamination in high k_parallel modes by several percent relative to a model which only includes sources in the main field-of-view, with the completeness of the foreground model setting the principal limitation on the amount of power removed. While small, a percent-level amount of foreground power is in itself more than enough to prevent recovery of any EoR signal from these modes. This result demonstrates that foreground subtraction for redshifted 21 cm experiments is truly a wide-field problem, and algorithms and simulations must extend beyond the main instrument field-of-view to potentially recover the full 21 cm power spectrum.
The second realization of the International Celestial Reference Frame (ICRF2) is based on Very Long Baseline Interferometry (VLBI) data at radio frequencies in X band and S band. The European Space Agency's Gaia mission, launched on 2013 December 19, started routine scientific operations in 2014 July. By scanning the whole sky, it is expected to observe ~500000 Quasi Stellar Objects in the optical domain. This means that, in the future, two extragalactic celestial reference frames, at two different frequency domains, will coexist. It will thus be important to align them very accurately. In 2012, the Laboratoire d'Astrophysique de Bordeaux (LAB) selected 195 sources from ICRF2 that will be observed by Gaia and should be suitable for aligning the radio and optical frames: they are called ICRF2-Gaia transfer sources. The LAB submitted a proposal to the International VLBI Service (IVS) to regularly observe these ICRF2-Gaia transfer sources at the same rate as Gaia observes them in the optical realm, e.g., roughly once a month. Of the 195 sources, all but one have been successfully observed in the 12 months prior to 2015 September 01. Table1 lists the 195 ICRF2-Gaia transfer sources. Beginning in 2003 June, the Goddard VLBI group developed a program to purposefully monitor when sources were observed and to increase the observations of under-observed sources. In 2013 March, we added all 195 ICRF2-Gaia transfer sources to the IVS source monitoring program with an observation target of 12 successful sessions per year. (1 data file).
We present first results from radio observations with the Murchison Widefield Array seeking to constrain the power spectrum of 21 cm brightness temperature fluctuations between the redshifts of 11.6 and 17.9 (113 and 75 MHz). 3 h of observations were conducted over two nights with significantly different levels of ionospheric activity. We use these data to assess the impact of systematic errors at low frequency, including the ionosphere and radio-frequency interference, on a power spectrum measurement. We find that after the 1-3 h of integration presented here, our measurements at the Murchison Radio Observatory are not limited by RFI, even within the FM band, and that the ionosphere does not appear to affect the level of power in the modes that we expect to be sensitive to cosmology. Power spectrum detections, inconsistent with noise, due to fine spectral structure imprinted on the foregrounds by reflections in the signal-chain, occupy the spatial Fourier modes where we would otherwise be most sensitive to the cosmological signal. We are able to reduce this contamination using calibration solutions derived from autocorrelations so that we achieve an sensitivity of 10(4) mK on comoving scales k <= 0.5 h Mpc(-1). This represents the first upper limits on the 21 cm power spectrum fluctuations at redshifts 12 <= z a <= 18 but is still limited by calibration systematics. While calibration improvements may allow us to further remove this contamination, our results emphasize that future experiments should consider carefully the existence of and their ability to calibrate out any spectral structure within the EoR window.
We present the 21 cm power spectrum analysis approach of the Murchison Widefield Array Epoch of Reionization project. In this paper, we compare the outputs of multiple pipelines for the purpose of validating statistical limits cosmological hydrogen at redshifts between 6 and 12. Multiple independent data calibration and reduction pipelines are used to make power spectrum limits on a fiducial night of data. Comparing the outputs of imaging and power spectrum stages highlights differences in calibration, foreground subtraction, and power spectrum calculation. The power spectra found using these different methods span a space defined by the various tradeoffs between speed, accuracy, and systematic control. Lessons learned from comparing the pipelines range from the algorithmic to the prosaically mundane; all demonstrate the many pitfalls of neglecting reproducibility. We briefly discuss the way these different methods attempt to handle the question of evaluating a significant detection in the presence of foregrounds.
ABSTRACT Accurate antenna beam models are critical for radio observations aiming to isolate the redshifted 21 cm spectral line emission from the Dark Ages and the Epoch of Reionization (EOR) and unlock the scientific potential of 21 cm cosmology. Past work has focused on characterizing mean antenna beam models using either satellite signals or astronomical sources as calibrators, but antenna-to-antenna variation due to imperfect instrumentation has remained unexplored. We characterize this variation for the Murchison Widefield Array (MWA) through laboratory measurements and simulations, finding typical deviations of the order of ±10%–20% near the edges of the main lobe and in the sidelobes. We consider the ramifications of these results for image- and power spectrum-based science. In particular, we simulate visibilities measured by a 100 m baseline and find that using an otherwise perfect foreground model, unmodeled beam-forming errors severely limit foreground subtraction accuracy within the region of Fourier space contaminated by foreground emission (the “wedge”). This region likely contains much of the cosmological signal, and accessing it will require measurement of per-antenna beam patterns. However, unmodeled beam-forming errors do not contaminate the Fourier space region expected to be free of foreground contamination (the “EOR window”), showing that foreground avoidance remains a viable strategy.
The second realization of the International Celestial Reference Frame (ICRF2), which is the current fundamental celestial reference frame adopted by the International Astronomical Union, is based on Very Long Baseline Interferometry (VLBI) data at radio frequencies in X band and S band. The European Space Agency’s Gaia mission, launched on 2013 December 19, started routine scientific operations in 2014 July. By scanning the whole sky, it is expected to observe ∼500,000 Quasi Stellar Objects in the optical domain an average of 70 times each during the five years of the mission. This means that, in the future, two extragalactic celestial reference frames, at two different frequency domains, will coexist. It will thus be important to align them very accurately. In 2012, the Laboratoire d’Astrophysique de Bordeaux (LAB) selected 195 sources from ICRF2 that will be observed by Gaia and should be suitable for aligning the radio and optical frames: they are called ICRF2-Gaia transfer sources. The LAB submitted a proposal to the International VLBI Service (IVS) to regularly observe these ICRF2-Gaia transfer sources at the same rate as Gaia observes them in the optical realm, e.g., roughly once a month. We describe our successful effort to implement such a program and report on the results. Most observations of the ICRF2-Gaia transfer sources now occur automatically as part of the IVS source monitoring program, while a subset of 37 sources requires special attention. Beginning in 2013, we scheduled 25 VLBI sessions devoted in whole or in part to measuring these 37 sources. Of the 195 sources, all but one have been successfully observed in the 12 months prior to 2015 September 01. Of the sources, 87 met their observing target of 12 successful sessions per year. The position uncertainties of all of the ICRF2-Gaia transfer sources have improved since the start of this observing program. For a subset of 24 sources whose positions were very poorly known, the uncertainty has decreased, on average, by a factor of four. This observing program is successful because the two main goals were reached for most of the 195 ICRF2-Gaia transfer sources: observing at the requested target of 12 successful sessions per year and improving the position uncertainties to better than 200 μas for both R.A. and decl. However, scheduling some of the transfer sources remains a challenge because of network geometry and the weakness of the sources, and this will be one focus of future sessions used in this ongoing program.
ABSTRACT The second realization of the International Celestial Reference Frame (ICRF2), which is the current fundamental celestial reference frame adopted by the International Astronomical Union, is based on Very Long Baseline Interferometry (VLBI) data at radio frequencies in X band and S band. The European Space Agency’s Gaia mission, launched on 2013 December 19, started routine scientific operations in 2014 July. By scanning the whole sky, it is expected to observe ∼500,000 Quasi Stellar Objects in the optical domain an average of 70 times each during the five years of the mission. This means that, in the future, two extragalactic celestial reference frames, at two different frequency domains, will coexist. It will thus be important to align them very accurately. In 2012, the Laboratoire d’Astrophysique de Bordeaux (LAB) selected 195 sources from ICRF2 that will be observed by Gaia and should be suitable for aligning the radio and optical frames: they are called ICRF2-Gaia transfer sources. The LAB submitted a proposal to the International VLBI Service (IVS) to regularly observe these ICRF2-Gaia transfer sources at the same rate as Gaia observes them in the optical realm, e.g., roughly once a month. We describe our successful effort to implement such a program and report on the results. Most observations of the ICRF2-Gaia transfer sources now occur automatically as part of the IVS source monitoring program, while a subset of 37 sources requires special attention. Beginning in 2013, we scheduled 25 VLBI sessions devoted in whole or in part to measuring these 37 sources. Of the 195 sources, all but one have been successfully observed in the 12 months prior to 2015 September 01. Of the sources, 87 met their observing target of 12 successful sessions per year. The position uncertainties of all of the ICRF2-Gaia transfer sources have improved since the start of this observing program. For a subset of 24 sources whose positions were very poorly known, the uncertainty has decreased, on average, by a factor of four. This observing program is successful because the two main goals were reached for most of the 195 ICRF2-Gaia transfer sources: observing at the requested target of 12 successful sessions per year and improving the position uncertainties to better than 200 μas for both R.A. and decl. However, scheduling some of the transfer sources remains a challenge because of network geometry and the weakness of the sources, and this will be one focus of future sessions used in this ongoing program.
The Murchison Widefield Array (MWA) has collected hundreds of hours of Epoch of Reionization (EoR) data and now faces the challenge of overcoming foreground and systematic contamination to reduce the data to a cosmological measurement. We introduce several novel analysis techniques, such as cable reflection calibration, hyper-resolution gridding kernels, diffuse foreground model subtraction, and quality control methods. Each change to the analysis pipeline is tested against a two-dimensional power spectrum figure of merit to demonstrate improvement. We incorporate the new techniques into a deep integration of 32 hours. of MWA data. This data set is used to place a systematic-limited upper limit on the cosmological power spectrum of Delta(2) <= 2.7 x 10(4) mK(2) at k = 0.27 h Mpc(-1) and z = 7.1, consistent with other published limits, and a modest improvement (factor of 1.4) over previous MWA results. From this deep analysis, we have identified a list of improvements to be made to our EoR data analysis strategies. These improvements will be implemented in the future and detailed in upcoming publications.
Abstract The science cases for incorporating high time resolution capabilities into modern radio telescopes are as numerous as they are compelling. Science targets range from exotic sources such as pulsars, to our Sun, to recently detected possible extragalactic bursts of radio emission, the so-called fast radio bursts (FRBs). Originally conceived purely as an imaging telescope, the initial design of the Murchison Widefield Array (MWA) did not include the ability to access high time and frequency resolution voltage data. However, the flexibility of the MWA’s software correlator allowed an off-the-shelf solution for adding this capability. This paper describes the system that records the 100 μs and 10 kHz resolution voltage data from the MWA. Example science applications, where this capability is critical, are presented, as well as accompanying commissioning results from this mode to demonstrate verification.
We present the results of a survey for low-frequency radio emission from 17 known exoplanetary systems with the Murchison Widefield Array. This sample includes 13 systems that have not previously been targeted with radio observations. We detected no radio emission at 154 MHz, and put 3 sigma upper limits in the range 15.2-112.5 mJy on this emission. We also searched for circularly polarized emission and made no detections, obtaining 3 sigma upper limits in the range 3.4-49.9 mJy. These are comparable with the best low-frequency radio limits in the existing literature and translate to luminosity limits of between 1.2 x 10(14) and 1.4 x 10(17) W if the emission is assumed to be 100 per cent circularly polarized. These are the first results from a larger program to systematically search for exoplanetary emission with the MWA.
Low-frequency, wide field-of-view (FOV) radio telescopes such as the Murchison Widefield Array (MWA) enable the ionosphere to be sampled at high spatial completeness. We present the results of the first power spectrum analysis of ionospheric fluctuations in MWA data, where we examined the position offsets of radio sources appearing in two data sets. The refractive shifts in the positions of celestial sources are proportional to spatial gradients in the electron column density transverse to the line of sight. These can be used to probe plasma structures and waves in the ionosphere. The regional (10-100km) scales probed by the MWA, determined by the size of its FOV and the spatial density of radio sources (typically thousands in a single FOV), complement the global (100-1000km) scales of GPS studies and local (0.01-1km) scales of radar scattering measurements. Our data exhibit a range of complex structures and waves. Some fluctuations have the characteristics of traveling ionospheric disturbances, while others take the form of narrow, slowly drifting bands aligned along the Earth's magnetic field.
 Rachel Webster合作论文数School of Physics, University of Melbourne67
 Rigel Cappallo合作论文数Haystack Observatory, Massachusetts Institute of Technology62
 Alan E. E. Rogers合作论文数61Stephen R. Mcwhirter合作论文数53
 Colin J. Lonsdale合作论文数Massachusetts Institute of Technology Haystack Observatory51
 Randall Wayth合作论文数Curtin Institute of Radio Astronomy, School of Electrical Engineering, Computing and Mathematical Sciences, Faculty of Science and Engineering, Curtin University;SKA Observatory50
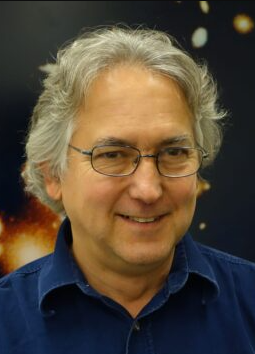 Edward Morgan合作论文数Kavli Institute for Astrophysics and Space Research, Massachusetts Institute of Technology50
 Miguel F. Morales合作论文数Department of Physics, College of Arts & Sciences, University of Washington49
 Divya Oberoi合作论文数Tata Institute of Fundamental Research National Centre for Radio Astrophysics49
 Judd Bowman合作论文数LoCo Lab, School of Earth and Space Exploration, Arizona State University;College of Liberal Arts and Sciences, Arizona State University49K. S. Srivani合作论文数48
 Prabu Thiagaraj合作论文数Raman Research Institute48E. Kratzenberg合作论文数47
 Steven J Tingay合作论文数International Centre for Radio Astronomy Research, Curtin University47
 Udaya Shankar Narayana Rao合作论文数Raman Research Institute47
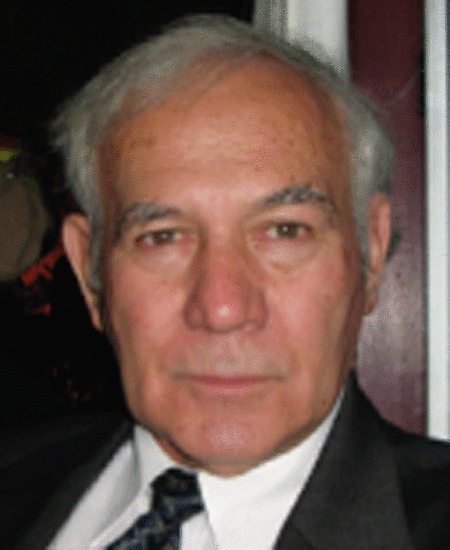 Mervyn J. Lynch合作论文数CSIRO Division of Atmospheric Research47Daniel A. Mitchell合作论文数Australia Telescope Natl Facil, CSIRO Astron & Space Sci46Stephen Mark Ord合作论文数Swinburne University of Technology;Centre for Astrophysics and Supercomputing;Centre for Astrophysics and Supercomputing, Swinburne University of Technology46
 Lincoln J. Greenhill合作论文数Department of Astronomy, Faculty of Arts and Sciences, Harvard University;Smithsonian Astrophysical Observatory46David Emrich合作论文数45
 Ravi Subrahmanyan合作论文数Raman Research Institute44Frank H Briggs合作论文数44
 David Kaplan合作论文数Department of Physics, College of Letters & Science, University of Wisconsin-Milwaukee42
 Andrew John Williams合作论文数42
 Avinash A. Deshpande合作论文数Raman Res Inst40
 Jacqueline N. Hewitt合作论文数Department of Physics, Massachusetts Institute of Technology40Michael Waterson合作论文数University of Newcastle upon Tyne39C. L. Williams合作论文数38Ronald S Goeke合作论文数37Bernardi G.合作论文数36B. J. Hazelton合作论文数35
 Irwin Shapiro合作论文数Department of Astronomy, Faculty of Arts and Sciences, Harvard University33
 Bryan M Gaensler合作论文数Division of Physical and Biological Sciences, University of California, Santa Cruz;Department of Astronomy and Astrophysics, University of California, Santa Cruz32A. E. Niell合作论文数29A. Roshi合作论文数28M. Johnston-Hollitt合作论文数26Joseph E. Salah合作论文数23
 Emil Lenc合作论文数ATNF23
 Natasha Hurley-Walker合作论文数International Centre for Radio Astronomy Research, Curtin University;Curtin Institute of Radio Astronomy, School of Electrical Engineering, Computing and Mathematical Sciences, Faculty of Science and Engineering, Curtin University22
 André Offringa合作论文数Kapteyn Astronomical Institute, Faculty of Science and Engineering, University of Groningen;ASTRON Netherlands Institute for Radio Astronomy22b b kincaid合作论文数20J. Stevens合作论文数20Bruce A. Mckinley合作论文数Department of Surgery, University of Texas at Houston Medical School20
 David E. Herne合作论文数20
 Stuart Wyithe合作论文数School of Physics, University of Melbourne19
 John D Bunton合作论文数Australia Telescope National Facility19Juan M Marcaide合作论文数18L Desouza合作论文数18T. A. Clark合作论文数goddard space flight center18




