Paul Crutzen received his doctorate in meteorology from the University of Stockholm in 1968 and was awarded the Nobel Prize in Chemistry in 1995. In addition to chemistry and atmospheric science, however, the breadth of his accomplishments has also been recognized by biologists, Earth system scientists, and geologists. This tribute provides some insight into Crutzen's career and how it contributed to so many scientific disciplines. In addition, we offer a road map showing how these diverse contributions were woven together over the course of more than five decades of research. The citation for the 1995 Nobel Prize reads that it was given for "work in atmospheric chemistry, particularly concerning the formation and decomposition of ozone." The inclusion of the wording "formation horizontal ellipsis of ozone" applies only to him among the three laureates (Crutzen, Mario Molina, and F. Sherwood Rowland). His research on tropospheric chemistry led to seminal studies of tropical biomass burning, which eventually evolved into the concept later known as "nuclear winter," a topic in the forefront of far-ranging popular discussions in the 1980s. Last, Crutzen's proposal for the emergence of the "Anthropocene" as a new geological epoch that would terminate the 11,700-yr-old Holocene is considered by the Earth system science community to be the most pronounced trademark of his remarkable career. Crutzen also received American Meteorological Society's Battan Award for his coauthorship of Atmosphere, Climate, and Change, recognized by the organization as the best book for general audiences. In the later years of his career, as a member of the Pontifical Academy of Sciences, Crutzen was a key player in the formulation of Laudato Si', Pope Francis's encyclical on climate change, which was released in advance of the Conference of Parties (COP 21) meeting that announced the formulation of the Paris Climate Accords in 2015.
Naturally occurring ozone-rich stratosphere-to-troposphere transport (STT) intrusions and biomass burning (BB) plumes reaching the surface can contribute to exceedances of the U.S. National Ambient Air Quality Standards for ground-level ozone (70 ppbv implemented in 2015). Additionally, fires can inject significant pollution into the free troposphere where it can be transported long distances. The combined air quality impacts from these sources on ozone have only been analyzed in a few case studies for the Midwest United States. Here we study ozone impacts in a Midwestern city, for the first time in St. Louis, Missouri, using a series of ozonesonde profiles taken during the Studies of Emissions and Atmospheric Composition, Clouds and Climate Coupling by Regional Surveys (SEAC(4)RS) field campaign in August-September 2013. All ozonesondes showed enhancements above the background profile levels (similar to 55 ppbv) throughout each tropospheric column. Two models were used to estimate ozone origins in columns. A chemical transport model identified STT enhancements equivalent to 10 to 15 ppbv over the background with a 10% to 15% contribution overall to the column. Two FLEXPART-WRF simulations, one with smoke in the boundary layer and another with smoke above, identified BB enhancements equivalent to 10 to 80 ppbv. Overall, the total BB contribution is 15% to 30% of the total column. Five ozonesondes showed signatures of mixed BB plumes and STT intrusions. During this study period, BB in the western United States contributed 70% to ozone enhancements in the total column compared to 3% from the central United States and 27% from other areas. Plain Language Summary Because man-made emissions are decreasing, concentrations of harmful ozone pollution have also decreased in many areas of the United States. Not all sources can be easily controlled however. For example, biomass burning emits lots of pollutants to the atmosphere, and descending air from the stratosphere can bring with it high levels of ozone. These sources can pollute first the air above us, and then when the air is transported to the surface, it can pollute the air we breathe. In this study we used balloons to measure ozone pollution as it changes from the surface to high in the atmosphere. We then used computer models to identify the sources responsible for higher pollution levels. Our study was part of a major field campaign that took place in the Midwest United States in the summer of 2013.
Remotely-sensed identification of ozone stress in crops can allow for selection of ozone resistant genotypes, improving yields. This is critical as population, food demand, and background tropospheric ozone are projected to increase over the next several decades. Visual scores of common ozone damage have been used to identify ozone-stress in bio-indicator plants. This paper evaluates the use of a visual scoring metric of ozone damage applied to soybeans. The scoring of the leaves is then combined with hyperspectral data to identify spectral indices specific to ozone damage. Two genotypes of soybean, Dwight and Pana, that have shown different sensitivities to ozone, were grown and visually scored for ozone-specific damage on multiple dates throughout the growing season. Leaf reflectance, foliar biophysical properties, and yield data were collected. Additionally, ozone bio-indicator plants, snap beans, and common milkweed, were investigated with visual scores and hyperspectral leaf data for comparison. The normalized difference spectral index (NDSI) was used to identify the significant bands in the visible (VIS), near infrared (NIR), and shortwave infrared (SWIR) that best correlated with visual damage score when used in the index. Results were then compared to multiple well-established indices. Indices were also evaluated for correlation with seed and pod weight. The ozone damage scoring metric for soybeans evaluated in August had a coefficient of determination of 0.60 with end-of-season pod weight and a Pearson correlation coefficient greater than 0.6 for photosynthetic rate, stomatal conductance, and transpiration. NDSI [R558, R563] correlated best with visual scores of ozone damage in soybeans when evaluating data from all observation dates. These wavelengths were similar to those identified as most sensitive to visual damage in August when used in NDSI (560 nm, 563 nm). NDSI [R560, R563] in August had the highest coefficient of determination for individual pod weight (R2 = 0.64) and seed weight (R2 = 0.54) when compared against 21 well-established indices used for identification of pigment or photosynthetic stress in plants. When evaluating use of spectral bands in NDSI, longer wavelengths in SWIR were identified as more sensitive to ozone visual damage. Trends in the bands and biophysical properties of the soybeans combined with evaluation of ozone data indicate likely timing of significant ozone damage as after late-July for this season. This work has implications for better spectral detection of ozone stress in crops and could help with efforts to identify ozone tolerant varieties to increase future yield.
The NASA/Smithsonian Tropospheric Emissions: Monitoring of Pollution (TEMPO; tempo.si.edu) satellite instrument will measure atmospheric pollution and much more over Greater North America at high temporal resolution (hourly or better in daylight, with selected observations at 10 minute or better sampling) and high spatial resolution (10 km(2) at the center of the field of regard). It will measure ozone (O-3) profiles (including boundary layer O-3), and columns of nitrogen dioxide (NO2), nitrous acid (HNO2), sulfur dioxide (SO2), formaldehyde (H2CO), glyoxal (C2H2O2), water vapor (H2O), bromine oxide (BrO), iodine oxide (IO), chlorine dioxide (OClO), as well as clouds and aerosols, foliage properties, and ultraviolet B (UVB) radiation. The instrument has been delivered and is awaiting spacecraft integration and launch in 2022. This talk describes a selection of TEMPO applications based on the TEMPO Green Paper living document (http://tempo.si.edu/publications.html). Applications to air quality and health will be summarized. Other applications presented include: biomass burning and O-3 production; aerosol products including synergy with GOES infrared measurements; lightning NOx; soil NOx and fertilizer application; crop and forest damage from O-3; chlorophyll and primary productivity; foliage studies; halogens in coastal and lake regions; ship tracks and drilling platform plumes; water vapor studies including atmospheric rivers, hurricanes, and corn sweat; volcanic emissions; air pollution and economic evolution; high-resolution pollution versus traffic patterns; tidal effects on estuarine circulation and outflow plumes; air quality response to power blackouts and other exceptional events.
The effects of increasing ambient ozone (O3) concentrations on food security has become a major concern as the demand for agricultural productivity is projected to increase significantly over the next several decades. In this contribution, the responses of common soybean genotypes (AK-HARROW, PI88788, DWIGHT, PANA, and WILLIAMS82) to ambient O3 are characterized using hyperspectral data and foliar biophysical, mineral nutrient concentrations and soybean yield. Specifically, leaf reflectance spectra measured at different growth stages and canopy layers were used to examine the spectral indices that were most strongly correlated with leaf physiological status. The effects of elevated O3 on six important nutrients (K, Ca, Mg, Fe, Mn and Cu) were evaluated by analyzing the variations in nutrient concentrations at two critical growth stages with increasing ambient O3 concentration using Partial Least Square Regression (PLSR). Lastly, the identified best spectral indices and the robust nutrient prediction models were extrapolated to the entire growth period to explore their ability to track the effects of ambient O3 concentrations on soybean physiology and nutrient uptake. The results showed that fluorescence yield (ΔF/Fm’) and photochemical quenching (qP) appear to be good indicators of soybean physiological responses to O3 stress that are echoed by the harvest index (HI). Newly identified normalized difference spectral index (NDSI) [R416, R2371] always had the highest correlation (R2 > 0.6) with ΔF/Fm’, qP and electron transport rate (ETR, μmol m−2 s−1) compared to the published indices. Additionally, there were significant and broad spectral regions in visible and near infrared region that were well-correlated with ΔF/Fm’ and selected NDSIs that were applicable to satellite observations. The results of nutrient modeling using PLSR explained 54–87% of the variance in nutrient concentrations, and the predicted mineral nutrient accumulation throughout the growing season reflected the responses of ozone tolerant and sensitive genotypes well. NDSI [R416, R2371] demonstrated great potential in regard to its sensitivity in tracking plant physiological responses to changing ambient O3 concentrations. The outcome of this research has potential implications for development of space-based observation of large-scale crop responses to O3 damage, as well as for biotechnological breeding efforts to improve ozone tolerance under future climate scenarios.
Estimating crop biophysical and biochemical parameters with high accuracy at low-cost is imperative for high-throughput phenotyping in precision agriculture. Although fusion of data from multiple sensors is a common application in remote sensing, less is known on the contribution of low-cost RGB, multispectral and thermal sensors to rapid crop phenotyping. This is due to the fact that (1) simultaneous collection of multi-sensor data using satellites are rare and (2) multi-sensor data collected during a single flight have not been accessible until recent developments in Unmanned Aerial Systems (UASs) and UAS-friendly sensors that allow efficient information fusion. The objective of this study was to evaluate the power of high spatial resolution RGB, multispectral and thermal data fusion to estimate soybean (Glycine max) biochemical parameters including chlorophyll content and nitrogen concentration, and biophysical parameters including Leaf Area Index (LAI), above ground fresh and dry biomass. Multiple low-cost sensors integrated on UASs were used to collect RGB, multispectral, and thermal images throughout the growing season at a site established near Columbia, Missouri, USA. From these images, vegetation indices were extracted, a Crop Surface Model (CSM) was advanced, and a model to extract the vegetation fraction was developed. Then, spectral indices/features were combined to model and predict crop biophysical and biochemical parameters using Partial Least Squares Regression (PLSR), Support Vector Regression (SVR), and Extreme Learning Machine based Regression (ELR) techniques. Results showed that: (1) For biochemical variable estimation, multispectral and thermal data fusion provided the best estimate for nitrogen concentration and chlorophyll (Chl) a content (RMSE of 9.9% and 17.1%, respectively) and RGB color information based indices and multispectral data fusion exhibited the largest RMSE 22.6%; the highest accuracy for Chl a + b content estimation was obtained by fusion of information from all three sensors with an RMSE of 11.6%. (2) Among the plant biophysical variables, LAI was best predicted by RGB and thermal data fusion while multispectral and thermal data fusion was found to be best for biomass estimation. (3) For estimation of the above mentioned plant traits of soybean from multi-sensor data fusion, ELR yields promising results compared to PLSR and SVR in this study. This research indicates that fusion of low-cost multiple sensor data within a machine learning framework can provide relatively accurate estimation of plant traits and provide valuable insight for high spatial precision in agriculture and plant stress assessment.
We use a regional scale photochemical transport model to investigate the surface concentrations and column integrated amounts of ozone (O3) and nitrogen dioxide (NO2) during a pollution event that occurred in the St. Louis metropolitan region in 2012. These trace gases will be two of the primary constituents that will be measured by TEMPO, an instrument on a geostationary platform, which will result in a dataset that has hourly temporal resolution during the daytime and ~4 km spatial resolution. Although air quality managers are most concerned with surface concentrations, satellite measurements provide a quantity that reflects a column amount, which may or may not be directly relatable to what is measured at the surface. The model results provide good agreement with observed surface O3 concentrations, which is the only trace gas dataset that can be used for verification. The model shows that a plume of O3 extends downwind from St. Louis and contains an integrated amount of ozone of ~ 16 DU (1 DU = 2.69 x 10¹⁶ mol. cm-2), a quantity that is two to three times lower than what was observed by satellite measurements during two massive pollution episodes in the 1980s. Based on the smaller isolatable emissions coming from St. Louis, this quantity is not unreasonable, but may also reflect the reduction of photochemical ozone production due to the implementation of emission controls that have gone into effect in the past few decades.
This short communication describes a package written in the Python language that facilitates analysis and visualization of transportation-related greenhouse gas emissions at sub-county scales. Known as the Small Area Greenhouse Gas Estimation Tool (SAGGET), the toolkit uses outputs from the Motor Vehicle Emission Simulator (MOVES) emission model to create emissions estimates and projections for user-defined geographies. The Python scripts issue calls to third party geoprocessing libraries; separate versions of the toolkit are available for use in conjunction with the ArcGIS library produced by ESRI, and for the open-source SpatiaLite extension to the SQLite database engine. We demonstrate the capacity of the toolkit by presenting small-area emissions estimates for the St. Louis region as a whole, and for a specific transportation corridor. The package is freely available from the East-West Gateway Council of Governments.
In this contribution, we examine the potential of using field spectroscopy to discriminate the responses of five soybean cultivars to background ozone concentration. Statistical analysis of hyperspectral data including one-way analysis of variance (ANOVA) and spectral instability analysis (ISI) were used to identify the most effective wavelengths in mapping and differentiating the five cultivars with different tolerance to ozone damage. Our results show several distinctive spectral regions that can be used for effective crop type mapping within species level, and quantifying the effects of ozone damage at leaf and canopy scales. This work demonstrates that hyperspectral remote sensors soon become available from government and private sector satellites offer a new set of high-resolution spectral data that will help to quantify impacts background ozone concentrations due to climate change on food security.
Total-column nitrogen dioxide (NO2) data collected by a ground-based sun-tracking spectrometer system (Pandora) and an photolytic-converter-based in-situ instrument collocated at NASA’s Langley Research Center in Hampton, Virginia were analyzed to study the relationship between total-column and surface NO2 measurements. The measurements span more than a year and cover all seasons. Surface mixing ratios are estimated via application of a planetary boundary-layer (PBL) height correction factor. This PBL correction factor effectively corrects for boundary-layer variability throughout the day, and accounts for up to ≈75 % of the variability between the NO2 data sets. Previous studies have made monthly and seasonal comparisons of column/surface data, which has shown generally good agreement over these long average times. In the current analysis comparisons of column densities averaged over 90 s and 1 h are made. Applicability of this technique to sulfur dioxide (SO2) is briefly explored. The SO2 correlation is improved by excluding conditions where surface levels are considered background. The analysis is extended to data from the July 2011 DISCOVER-AQ mission over the greater Baltimore, MD area to examine the method’s performance in more-polluted urban conditions where NO2 concentrations are typically much higher.
We examine the spectral signatures and foliar biophysical and biogeochemical properties of different soybean cultivars that are known to be sensitive in varying degrees to background concentrations of ozone (O 3 ). Specifically, the potential of plant biophysical variables from leaf reflectance spectra, including chlorophyll index, photochemical reflectance index, and leaf area index, to detect foliar O 3 damage is explored. The study was conducted at an agricultural test site located in Maryland Heights, Missouri, during the summer of 2014 where five different soybean cultivars were planted. Our results show that the soybean cultivars demonstrated different sensitivity to background O 3 as demonstrated by spectral indices and plant biophysical measurements. The outcome of this research has potential implications for development of space-based observation of large-scale crop responses to O 3 damage, as well as for biotechnological breeding efforts to improve O 3 tolerance under future climate scenarios, as background O 3 concentrations are expected to increase through the twenty-first century.
To illustrate how the present-day background concentrations of ground-level O3 damage the biosphere, we have established the St. Louis "Ozone Garden" Project as an educational and public outreach facility that provides platforms for observing and quantifying damage to plants. The St. Louis Ozone Gardens education/public outreach program is designed to increase public awareness of this environmental problem.
 John K. Creilson合作论文数31Robert Kalish合作论文数24James J. Szykman合作论文数17
 Paul J. Crutzen合作论文数Department of Atmospheric Chemistry, Max Planck Institute for Chemistry;Department of Meteorology, Stockholm University;University of Mainz16
 James Crawford合作论文数Langley Research Center, National Aeronautics and Space Administration16
 Anne Mee Thompson合作论文数Goddard Space Flight Center, National Aeronautics and Space Administration;Department of Atmospheric and Oceanic Science, College of Computer, Mathematical, and Natural Sciences, University of Maryland, College Park15
 Edward V. Browell合作论文数NASA Langley Research Center15Margaret R. Pippin合作论文数14Vincent G. Brackett合作论文数13Amy E. Wozniak合作论文数12D Nganga合作论文数12
 Doreen Neil合作论文数12Jassim Al-Saadi合作论文数Langley Research Center, National Aeronautics and Space Administration11
 R. B. Pierce合作论文数NESDIS, NOAA10
 David Edwards合作论文数Atmospheric Chemistry Observations & Modeling Lab, National Center for Atmospheric Research9Fred M. Vukovich合作论文数9
 Matthew Maimaitiyiming合作论文数8
 Daniel Jacob合作论文数John A. Paulson School of Engineering and Applied Sciences, Harvard University;Department of Earth & Planetary Sciences, Harvard University8
 Jay Herman合作论文数Joint Center for Earth Systems Technology, University of Maryland, Baltimore County8
 Kenneth E. Pickering合作论文数Atmospheric Chemistry and Dynamics Laboratory of the Earth Sciences Division, NASA Goddard Space Flight Center8
 Randall Martin合作论文数Center for Aerosol Science and Engineering, Department of Energy, Environmental, and Chemical Engineering, McKelvey School of Engineering, Washington University in Saint Louis8
 M. J. Newchurch合作论文数University of Alabama at Huntsville8b cros合作论文数7
 T. Knepp合作论文数Langley Res Ctr, NASA7
 William B. Grant合作论文数Sunlight, Nutrition and Health Research Center7Scott Janz合作论文数7
 Gary A. Morris合作论文数Buffalo Grove7A. Minga合作论文数6
 Brad Pierce合作论文数Department of Atmospheric and Oceanic Sciences, College of Letters & Science, University of Wisconsin-Madison6
 Douglas K. Martins合作论文数6
 Marta Fenn合作论文数Langley Research Center, National Aeronautics and Space Administration6
 Nickolay A Krotkov合作论文数Atmospheric Chemistry and Dynamics Laboratory, NASA Goddard Space Flight Center6K. Chance合作论文数5JR Olson合作论文数5
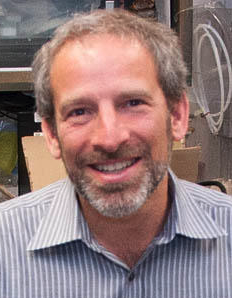 Ronald C. Cohen合作论文数Department of Chemistry, College of Chemistry, University of California, Berkeley;Department of Earth & Planetary Science, University of California, Berkeley;Energy and Environment Technologies Division, LBNL5Peter Zoogman合作论文数Harvard University, Harvard University5
 Glen W. Sachse合作论文数5Gerald L. Gregory合作论文数5Lenore Cowen合作论文数5
 Carolyn F. Butler合作论文数5
 Robert B. Chatfield合作论文数NASA Ames Research Center5
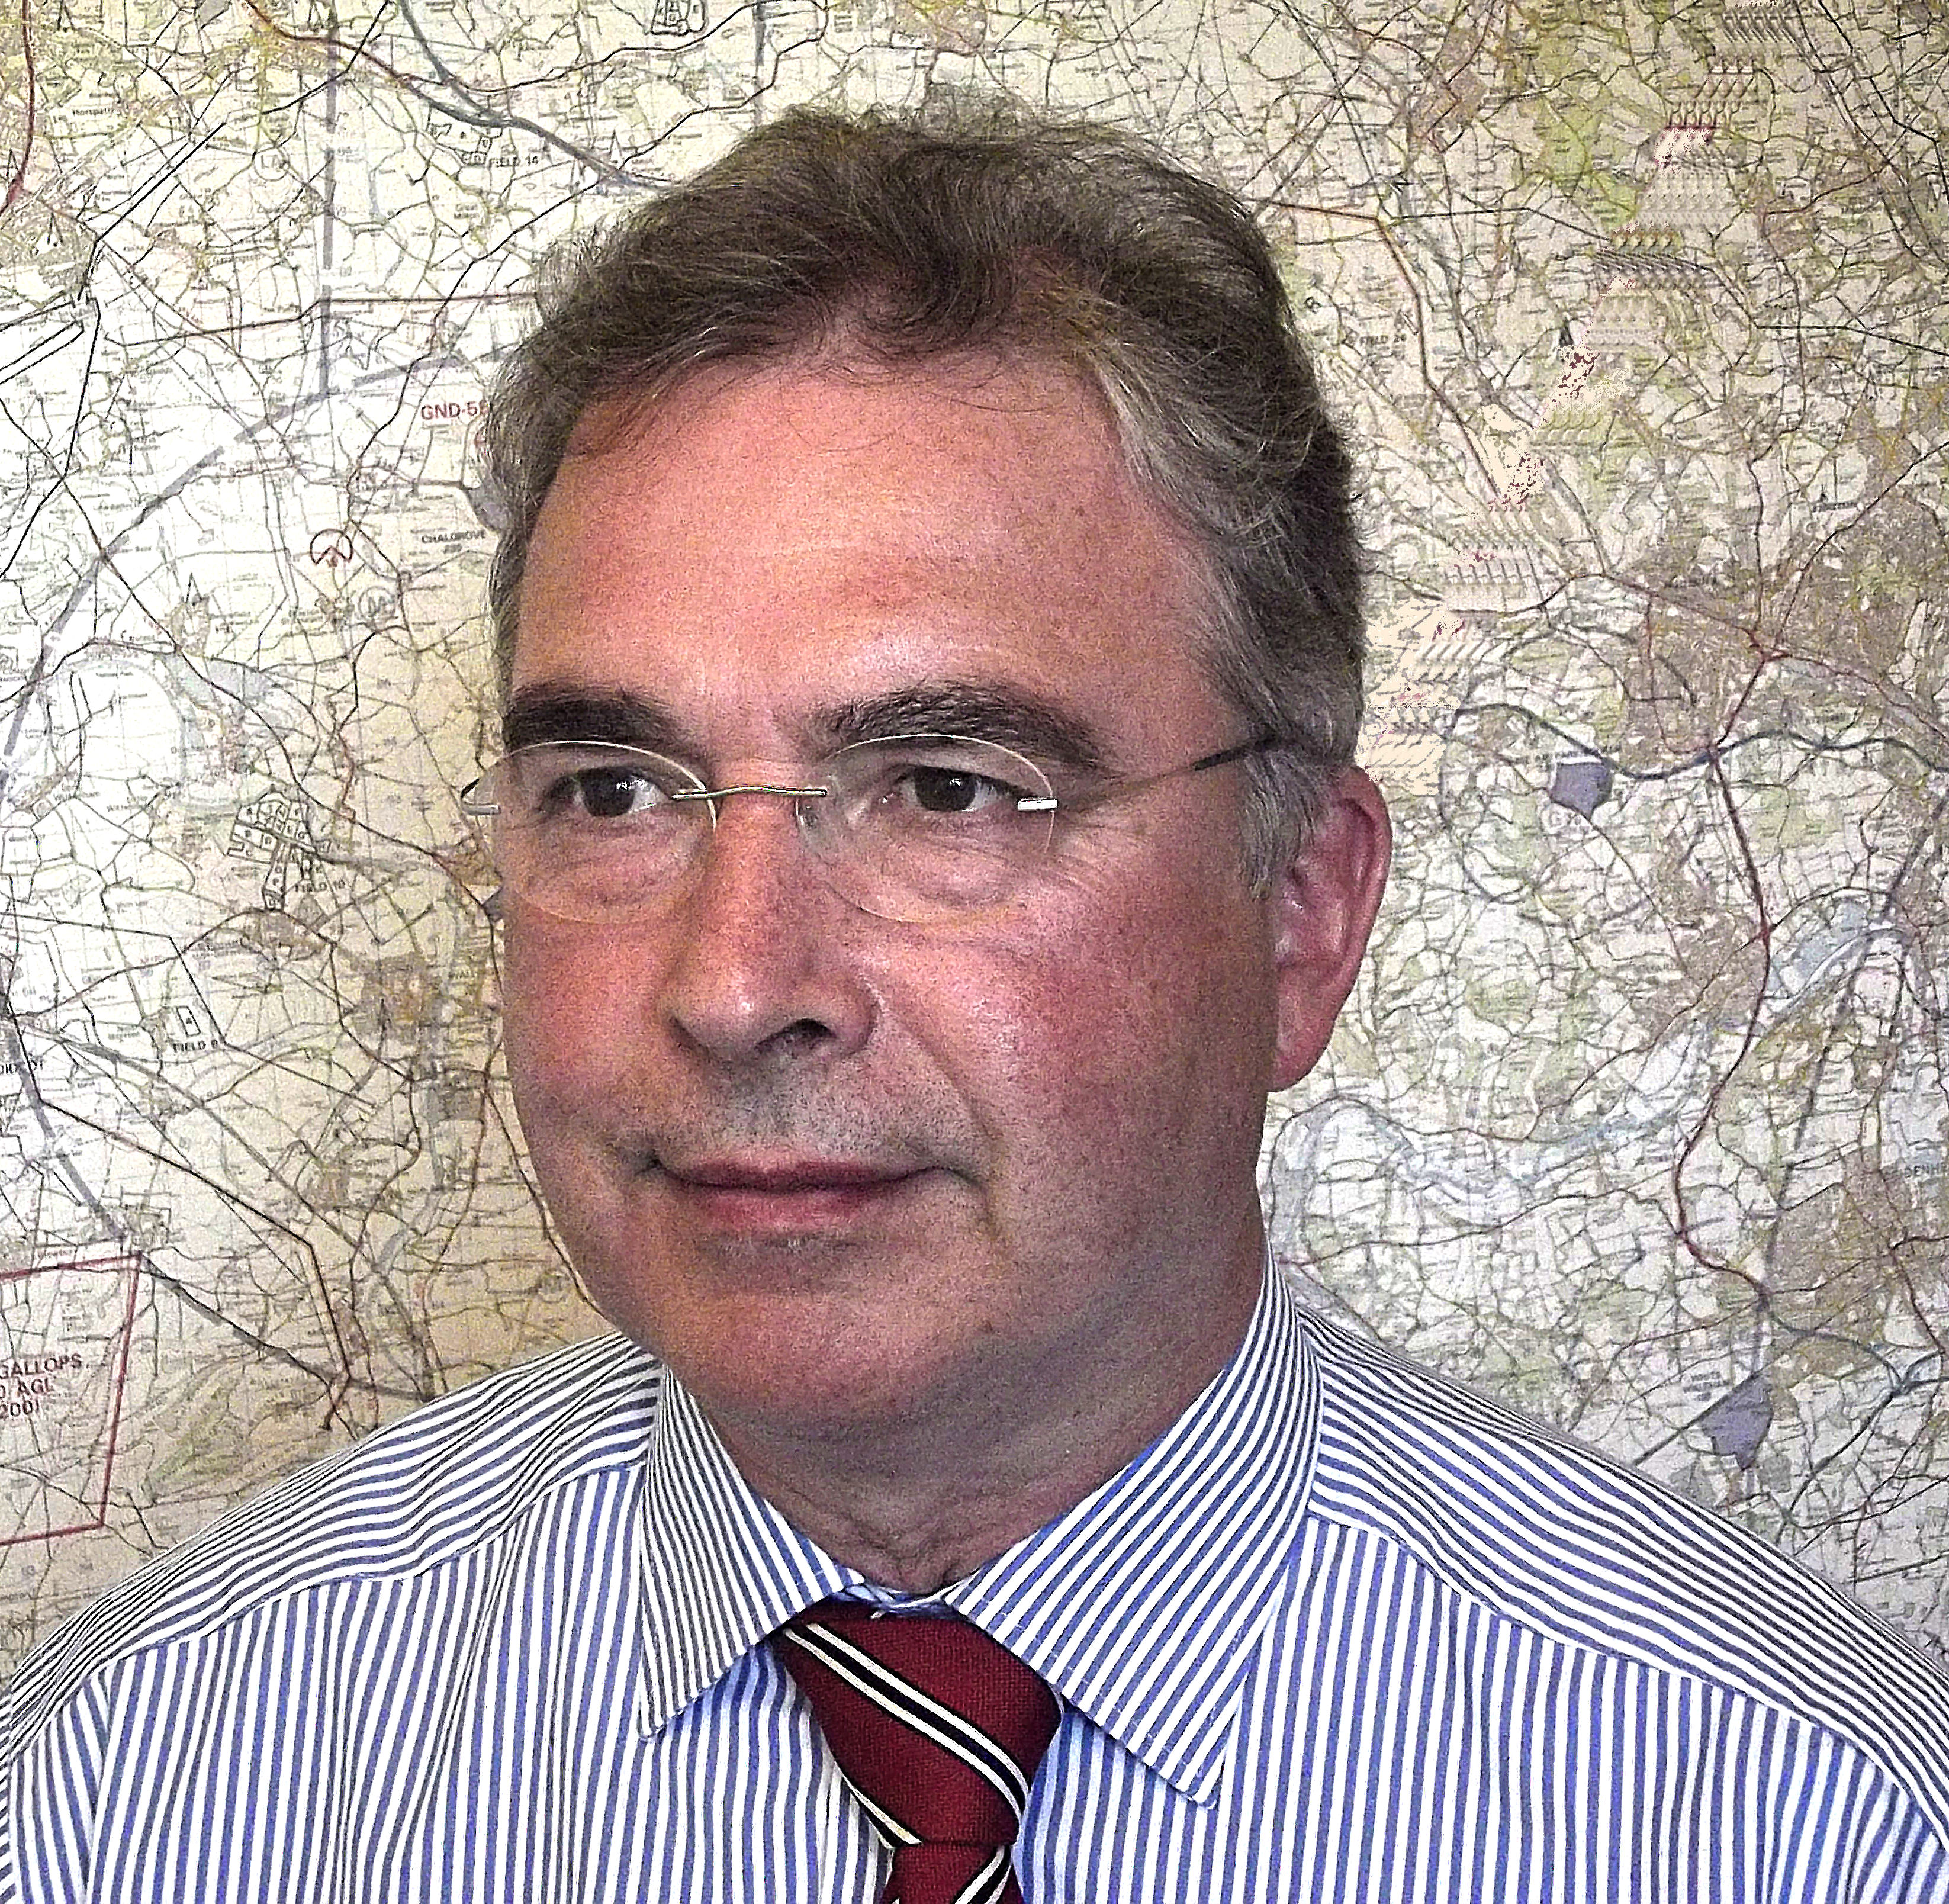 John P. Burrows合作论文数Institutes of Environmental Physics and Remote Sensing, University of Bremen5S. R. Kawa合作论文数5
 Omar Torres合作论文数NASA Langley Research Center5
 Andreas Richter合作论文数Institute of Environmental Physics, University of Bremen5Chieko Kittaka合作论文数5J. A. Al‐Saadi合作论文数4M. L. Silverman合作论文数4crystal toppin合作论文数4




