The water, food and energy security of millions of people is at risk in several regions of the tropical Andes because climate change is altering water storage in high Andean wetlands (bofedales), lakes and glacier ice. These features play a crucial role in delaying water release, particularly in many semiarid regions with pronounced seasonal precipitation, sustaining baseflows and water quality. Changing water availability impacts both high Andean pastoralist systems and other productive systems downstream, including bigger cities in the inter-Andean valleys. Here we outline the hydrological and geomorphological relationships between glaciers, lakes and bofedal wetlands, and the way in which catchment features such as moraines, talus slopes and sandar interact with catchment hydrology in the tropical Andes of Peru. We present a geomorphological map of catchment features in the Cordillera Vilcanota, Southern Peru, and explore how these features can impact hydrogeological processes. We suggest the ways in which well mapped and dated catchment features can provide a damming or groundwater/surface water exchange mechanism for bofedal development and sustenance. We find that glacial lakes will grow modestly as glaciers retreat, but will not provide an equivalent water storage to compensate for the loss of glacier ice. We find that bofedales are well developed within glacial limits, with glacial processes such as erosion and formation of moraines providing the poorly drained conditions suitable for their development. However, we find that the majority of the bofedales are largely hydrologically independent of contemporary glaciers, and could perhaps buffer water supply as glaciers dwindle and disappear. Such analysis enables an improved understanding of the timeframe for the formation of bofedal wetlands and for them to provide their key ecosystem services of water retention and remediation capacity, buffering drought, providing forage for high-Andean livestock herding, carbon storing and sequestration.
Coupled climate-ice-sheet modelling provides critical insights into the mechanisms underlying ice-sheet-climate feedback. These processes have strong implications for past and future climate change events, yet modelling efforts remain constrained by uncertainties in key model parameters. To address this limitation, we rely on comparisons between model outputs and available records of past ice sheets. Historically, this involved matching simulated ice sheets to reconstructed extent and volume derived from a range of geomorphological and sea level change data. Although these metrics are useful to validate ice sheet geometry and volume, they only provide limited information on ice sheet dynamics. New methods, which compare the footprint of reconstructed and simulated palaeo-ice streams, offer promising ways to incorporate a dynamical dimension into model calibration (Ely et al., 2024, Journal of Quaternary Science). In this project, we catalogue the distinct dynamical configurations observed in an ensemble of coupled climate-ice-sheet simulations of the Last Glacial Maximum (LGM, 21,000 years ago). This ensemble includes 124 equilibrium simulations generated using the coupled atmosphere-ice-sheet model FAMOUS-BISICLES, with variation applied to 12 model parameters representing ice dynamics, albedo and climate feedbacks (Patterson et al., 2025, EGUsphere). The ice sheet dynamics not only assess the model’s ability to replicate the LGM reconstructions of the Laurentide ice streams (Margold et al. 2018, Quaternary Science Reviews), but they also inform the sensitivity of the simulated ice sheets to climate forcing. Plausible simulations of the North American ice sheets in terms of volume and extent can be obtained across various regions of the parameters space, resulting in significant discrepancies in potential ice streaming patterns. Surface Mass Balance (SMB) is the main factor behind these changes in dynamical configurations: simulations with low accumulation tend to produce less numerous and intense ice streams, whereas high accumulation is associated with more vigorous ice streaming. In addition, the parametrisation of the ice dynamics influences the location and consistency of the ice streams, as well as the ability of the ice sheet to respond to climate change events. We find that simulations with relatively high SMB and ice dynamics parameters that enable fast-flowing and well-defined ice streams best match estimates of Last Glacial Maximum North American ice sheet extent, volume and ice stream location. Conversely, high friction coefficients and porous subglacial till, or low resolution of the ice sheet margins and the bedrock topography, result in ice stream patterns that are inconsistent with reconstructions and less responsive to climate forcing. This work demonstrates the relevance of comparison between reconstructions of past ice streams and model simulations to provide strong constraints on dynamical ice sheet models and ice sheet sensitivity to climate changes.
Tropical glaciers are important indicators of climate change, provide freshwater resources for downstream communities, and form an important component of the hydrological cycle. Understanding the dynamics and patterns of behaviour of tropical palaeoglaciers is important for interpreting their sensitivities and vulnerabilities. Glacier advances in the high tropical Peruvian Andes occurred multiple times during the last glacial cycle and Holocene, leaving complex geomorphological evidence on the landscape. The substantial topographic, geological and climatic variability in this region leads to high geomorphic diversity. However, few detailed geomorphological studies have been conducted to date, leading to considerable uncertainty in the behaviours and drivers of tropical palaeoglaciers. Here, we provide a detailed geomorphological analysis of the Cordillera Vilcanota, Cusco region, southern Peru (71 degrees W, 13.7 degrees S), and use morphostratigraphic principles to reconstruct the former maximum icefield extent and palaeoglacier advances. Across this domain, we mapped similar to 23,000 features encompassing five key environments: glacier, subglacial, ice-marginal, fluvial and lacustrine. The mapped features show evidence of both modern-day polythermal and temperate ice margins, with low meltwater volumes leading to small-scale glaciofluvial landform formation. However, larger moraines, beyond those well-dated to the Younger Dryas and Antarctic Cold Reversal, assumed to represent Last Glacial Maximum and earlier advances, suggest that conditions were temperate and drained by more substantial rivers, with coupled flow of ice and till, and evidence of subglacial scouring, drumlin formation and the deposition of substantial moraines and large palaeosandar. Our reconstructed maximum icefield covers 2,660 km(2) and was drained by multiple topographically constrained ice lobes across the region. In the north, these ice lobes reached an elevation of 3,500 m asl, but were limited to above 4,500 m asl in the south, likely reflecting the dominant moisture sources. Our geomorphological mapping reveals seven clear ice margins, morphostratigraphically correlated across the study region, reflecting at least seven palaeoglacier advances during the last glacial cycle, including the Late Glacial period and the Holocene.
Deglaciation alters hydrological processes in mountain catchments by modifying runoff regimes, impacting water quality, availability, and storage, with widespread consequences for downstream water security. While the timing and rate of glacier loss are increasingly well constrained, how glacier retreat translates into spatially heterogeneous water security risk remains poorly understood. In water-scarce catchments, small reductions in glacier melt may have severe impacts, whereas in water-abundant systems, large losses may be inconsequential. Risks can also differ substantially between upstream and downstream regions due to spatial heterogeneities in hazards, and the exposure and vulnerabilities of social-ecological systems.To address this gap, we present a conceptual and quantitative framework to assess deglaciation-driven water security risk in Andean catchments, grounded in a comprehensive risk assessment approach (risk = hazard × exposure × vulnerability). First results quantify the effects of glacier retreat on the hazard and exposure components using high-resolution hydrological simulations from the JULES land surface model. The analysis spans ten glaciated river basins across the Andes, covering a broad climatic gradient from hyper-arid to humid conditions. A key novelty is our spatially explicit approach, accounting for upstream-downstream heterogeneities in hazard and exposure quantifications.Our framework moves beyond glacier-centric assessments by explicitly linking cryospheric change to downstream water security risk across diverse hydro-climatic settings. By providing a transferable but region-specific method, our approach offers a foundation for identifying hotspots of emerging water security risk under continued glacier retreat.
We present a first global high-resolution map (30 m x 30 m) of high-altitudinal wetlands in the world's major mountain regions, i.e. the Andes, Rocky Mountains, Alps and High Mountain Asia. To map these wetlands, we employed a supervised classification approach using a random forest machine learning model and a selected set of predictors including vegetation, topographic, and surface moisture features. The predictors were derived from freely available radar and optical satellite imagery (Sentinel-1 and Sentinel-2), SRTM elevation data, and the global ecoregion map RESOLVE. We identify a total area of >30,500 km(2) of high-mountain wetlands. With this map we aim to enhance the understanding of wetland distribution in remote and often inaccessible mountain regions and enable a more reliable understanding of their role in the ecosystem functioning and water cycles of high mountain areas.
The Andes has the longest mountain range in the world, stretching over 7000 kilometres from Colombia in the tropics to the bottom of Chile in the extratropics. Millions of people depend on water supply from the Andes for their consumption, agriculture, hydropower, and ecosystem services. Often, this water comes from snow and glacier melt, and these water stores can be especially important in times of drought, or during dry seasons for regions with strong annual cycles of precipitation. The inaccessibility of the higher regions in Andes makes setting up weather stations difficult, and the extremely complex topography leads to sharp gradients in weather and climate with varying altitudes of snowline, therefore requiring very high-resolution models to accurately capture the small-scale processes occurring. Due to these challenges, snowfall and snowcover in the Andes remain poorly understood and difficult to model, which are critical to address in the face of a changing climate, with potential for future precipitation occurring in fewer, more extreme snowfall events. Here we present initial work optimising a high-resolution climate model over the Andes from Peru to the bottom of Chile. We have determined the best setup to model snowfall over the Andes in the Weather Research and Forecasting Model. The results of a sensitivity study with multiple different setups are compared to observations from weather stations and satellite data. We also show the capability of the model to represent extreme snowfall events at different latitudes. This model setup will be used to create both hindcasts and future projections of snowfall across the Andes mountain range, to better understand the implications for changing water resources in the Andes
Ice sheets have a memory that is stored within both the geometry and thermal properties of the ice. The current Greenland Ice Sheet is thus not in equilibrium with present-day climate, but is in fact affected by a complex product of past changes that occurred over millennial timescales. Therefore, simulating the late-Pleistocene evolution of the Greenland Ice Sheet accurately is important when running future projections using paleo model initialization procedures. Using a novel model-data comparison procedure, we ran an experiment that aimed to produce numerical model simulations that fit available empirical data on the extent and timing of the grounded margin evolution of the Greenland Ice Sheet from the global LGM (24 kyr BP) to 1850 AD. Given the numerous uncertain parameters and boundary conditions required by numerical ice sheet models, finding simulations which adequately replicate empirical data on past grounded ice extent is a challenging task. In an attempt to address this challenge, we ran a perturbed parameter ensemble of 100 ice-sheet-wide simulations at 5 km spatial resolution using the Parallel Ice Sheet Model. Our simulations are forced by the latest transient paleo-climate and ocean simulations of the isotope-enabled Community Earth System Model (iCESM 1.2 and 1.3). Using quantitative model-data comparison tools and the newly developed, Greenland-wide PaleoGrIS 1.0 isochrone reconstruction of former ice extent, each ensemble simulation’s fit with empirical data was assessed quantitatively across both space and time. Using our best-scoring simulations, we here present new insights into the former Greenland Ice Sheet’s likely response to transitional climatic phases throughout the last deglaciation. Secondly, our results suggest ice temperature, geometry, and glacial isostatic adjustment-induced mechanisms of centennial to millennial-scale inertia in ice-extent response to past climatic forcing, with potential implications for the future evolution of the ice sheet. Thirdly, our results show that different parameter combinations produce a better model-data fit during different time periods and for different regions of the ice sheet – i.e. parameter values that work well at one place or time, produce worse fit at others. We hypothesise that better paleo model initializations may be achieved using time- and space-dependent parameter configurations. Finally, after extending several past ensemble simulations to the end of the 21st century under CMIP6-derived forcing, we find that accounting for the past modifies projections of the future. Using a steady-state contemporary ice sheet as an initial state leads to vastly different projected sea level contributions when compared to simulations that perform well at recreating past glacial history.
High-altitude wetlands are critical ecosystems that store water, regulate downstream flows, and sustain biodiversity. Their persistence is tightly linked to continuous water inputs from precipitation, groundwater, snow and glacier melt, making them highly vulnerable to climate-driven shifts in mountain hydrology. Rapid glacier retreat, altered precipitation regimes, and rising temperatures are transforming water availability across mountain regions worldwide, but their consequences for wetland stability remain poorly understood. Here, using high-resolution satellite-based mapping (2019–2025) and statistical analyses, we investigate the spatiotemporal dynamics and hydroclimatic drivers of high-altitude wetlands at two tropical Andean study sites in Peru: Cordillera Vilcanota and La Raya. We demonstrate that precipitation is the primary driver of wetland seasonality, explaining up to 25% of the observed variability. This influence weakens in areas close to glaciers, where wetlands exhibit reduced seasonal fluctuations, suggesting a local dampening effect of glacial runoff on wetland wetting–drying cycles. Our spatially explicit analysis demonstrates that this dampening effect attenuates rapidly with distance and is no longer detectable beyond approx. 12 km from glaciers, indicating that the hydrological influence of glacier melt is highly localized and that most high-mountain wetlands are effectively decoupled from glacier-melt processes. The study highlights the critical role of glacier-wetland hydrological connectivity in the context of hydrological changes in mountain regions.
Glacial erratics are geologically distinctive rocks transported away from their source area by ice sheets and deposited in lithologically different bedrock areas. They have attracted much scientific curiosity with >24 000 observations across the British Isles. A common misinterpretation is that they took a nearly direct line of transport from source to resting position, neglecting to change ice flow directions during ice sheet growth and decay. To rectify this, we sequentially modelled erratic time-space trajectories at 1000-year timesteps using ice flowlines in an empirically constrained ice sheet model simulation to predict erratic deposition areas. We addressed the processes of entrainment and deposition by combining all potential trajectories into a single footprint of possible locations. Erratic dispersal is predicted for three geologically distinctive lithologies; Shap Granite of Northern England, Galway Granite of Ireland and the Glen Fyne igneous complex from Scotland. The footprint of predicted trajectories compared against 1883 observations of erratic locations was found to successfully explain 77% of the observed erratics. Most erratics were explained by flow directions during ice retreat; however, some required earlier ice divide shifts to produce potentially long-duration, multiphase pathways. Our analysis demonstrates the possibility of explaining many erratics without explicitly modelling the complex processes of entrainment and deposition. (c) 2025 The AuthorsJournal of Quaternary SciencePublished by John Wiley & Sons Ltd.
The food and water security of 90 million people depends on the Andean Mountain water tower, which is at risk in several regions because climate change is altering water storage in high altitude wetlands (bofedales), lakes, snow and glacier ice. These features play a crucial role in delaying water release, particularly in many semiarid regions with pronounced seasonal drought, sustaining baseflows and water quality. Changing water availability impacts both high Andean pastoralist systems and other productive systems downstream, including bigger cities in the inter-Andean valleys. Here we outline the hydrological and geomorphological relationships between glaciers, lakes and wetlands, and the way in which catchment features such as moraines, talus slopes and sandar interact with catchment hydrology in the tropical Andes of Peru. We present a geomorphological map of catchment features in the Cordillera Vilcanota, Cusco region, Peru, and explore how these features can impact hydrogeological processes. We explore the ways in which well mapped and dated catchment features can give a damming or groundwater/surface water exchange mechanism for bofedal development. Such analysis enables an improved understanding of the timeframe for the formation of wetlands and for them to provide their key ecosystem services of water retention capacity, buffering drought, providing forage for alpaca and herding, and carbon storing and sequestration.
Climate change has had a significant impact on the behaviour of the high mountain cryosphere, with widespread glacier retreat and mass loss now occurring in most of the planet’s glacierised mountain ranges over multi-decadal timescales. If we are to accurately understand the impacts of deglaciation on freshwater availability to communities downstream, robust modelling of future glacier meltwater yield is paramount. Meteorological observations at glacierised elevations are essential to drive simulations of the energy balance at glacier surfaces, and therefore glacier melt, although such records are sparse in most high mountain regions due to the logistical challenges associated with making even short-term measurements. The scarcity of high-altitude meteorological observations has resulted in only limited understanding of factors such as the spatial and temporal variability of temperature lapse rates, precipitation amounts and phase, and the prevalence of conditions suited to sublimation, all of which have an important influence on glacier mass loss rates at high elevation. Here we summarise the installation of meteorological and glacier ablation stations in different climatic zones of the South American Andes - the Tropical Andes of Peru (Nevado Ausangate basecamp, 4800 m, (13°48'45.96"S, 71°12'53.18"W) and Bolivia (Laguna Glaciar, 5300 m, 15°50'10.59"S, 68°33'11.30"W), the Subtropical Andes (Glaciar Universidad, Chile, 2540 m, 34°43'10.07"S, 70°20'44.98"W) and Patagonian Andes (Lago Tranquillo, Chile, 280 m, 46°35'47.00"S, 72°47'38.91"W) – as part of the NERC-funded Deplete and Retreat Project. Meteorological station records include time series of air temperature and pressure, relative humidity, wind speed and direction, incoming and outgoing short- and longwave radiation, precipitation amount and phase. Coincident glacier ablation is monitored at each site using ‘Smart Stakes’, recording surface elevation change on-glacier. We describe station situation, installation and preliminary measurements, along with aims and objectives of analyses using the meteorological time series.
Under current climate conditions the Greenland and Antarctic sheets are rapidly losing mass and these losses are projected to accelerate into the future. Consequently, potential changes in the ice marginal environment across these ice sheets are a future concern. Palaeo-ice sheets, such as the Scandinavian Ice Sheet, provide an opportunity to investigate ice-marginal changes over longer timescales that span a variety of physiographic and geological settings and climate conditions. Landform signatures across Fennoscandia reveal a range of palaeo-ice marginal settings, including lake-terminating, marine-terminating, and higher-altitude environments. This makes the landform record of the Scandinavian Ice Sheet a rich and diverse archive for studying ice margin behaviour. Furthermore, high-resolution digital elevation models (DEMs) that exist for the former bed of this ice sheet allow us to examine ice marginal settings and dynamics in unprecedented and consistent detail across Norway, Sweden and Finland. We present a geomorphological ice margin dataset of ~56,000 mapped features that categorises each ice margin by its dominant landform type of moraine, hummocky moraine, lateral meltwater channel or glaciofluvial sediment. We then use the morphology of the landforms and overprinting relationships to determine which landforms were likely formed prior to the last deglaciation. The distribution of landform-types in our dataset provides interesting insights into the behaviour of different sectors of the ice sheet. For example, we find ice margins characterised by lateral meltwater channels are almost exclusively found in locations of Quaternary sediment cover, which may indicate that surficial sediment thickness influences their formation, rather than the thermal regime of the ice. We also find ice margins defined by hummocky moraines are more prevalent at higher latitudes. We hypotheses this pattern may be controlled by lower ablation rates at higher latitudes. Additionally, we find contrasts in the density and size of the ice margins between the aquatic and land terminating environments, which results from differences in sedimentation processes within each environment.
Tropical Andean glaciers provide an important flux of freshwater to communities living both in high-altitude Cordillera and population centres downstream in countries such as Peru and Bolivia. Glacier recession threatens the sustainability of these water resources, and accurate modelling of future glacier behaviour is required to manage water stress in the region. These models must capture all processes contributing significantly to overall glacier mass budgets. Here we examine supraglacial pond and ice cliff development on three clean-ice glaciers in the Cordillera Vilcanota, Peru and their overall contribution to glacier mass balance. Whilst such features are common and well-studied on debris-covered glaciers, their development on debris-free glaciers has not been examined in detail. We use high-resolution contemporary and historical satellite imagery and repeat drone surveys to examine surface structure and geometry change over three glaciers during 1977-2024. We show how cliff and pond formation is driven by aspect-dependent surface melt of crevasse walls. These features act as ice loss hotspots, which enhance glacier net mass loss by similar to 10% despite accounting for <5% glacier surface area. Incorporation of such amplified ice loss processes should be a priority for glacier model advances to achieve more accurate projections of future tropical glacier recession.
The field of palaeo-glaciology has evolved from inquisitiveness about glaciated landscapes - how they came into being - into the wider role of improving glaciological understanding and more recently, into testing or improving the fidelity of ice sheet modelling approaches. Such endeavors are crucial for improving forecasts of today’s diminishing polar ice sheets and for predicting sea-level rise. The PalGlac project (2018 to 2024) is using glacial landform mapping and analysis to advance our understanding of ice sheets, and in this talk, we will focus on the demise of the Scandinavian Ice Sheet and how landform data is used to either test or calibrate (nudge) ice sheet modelling simulations.Glacial landforms such as drumlins, moraines, meltwater channels and eskers record spatially extensive components of ice sheet activity, namely 1) ice flow geometry and thermal regime, 2) the pattern of ice-marginal recession, and 3) the subglacial flow of meltwater that likely modulated the first two. High-resolution (metres) digital elevation models (DEMs) are revolutionising the mapping and understanding of glacial landforms (Johnson et al. 2015). They permit detailed investigation across areas so large as to have been unimaginable decades ago. We here report on a multi-person mapping investigation of glacial landforms across the land areas of Fennoscandia, northern Europe, and parts of Russia, and which have yielded over 350,000 individual features recording ice flow (250,000), ice margins (70,000), and meltwater routing (30,000). All data, held in a GIS, are used to build a first-order reconstruction of the pattern of ice flow changes and ice margin retreat. Much of these data reveal a useful confirmation and replication of prior studies, which we now know with improved robustness, and with many new aspects being revealed, notably in ice divide positions.Our ultimate aim is to build a simulation of whole ice sheet growth and decay incorporating changes in ice thickness and flow geometry and tracking successive ice-marginal positions. This is being achieved using the mapped landform data along with chronological data (Hughes et al. 2016), glacio-isostatic constraints and other constraints from the literature and comparing them with ice sheet modelling simulations using PISM (Winkelmann et al. 2011). We focus on using identified empirical changes in ice flow geometry (from the landforms) to choose between dozens of alternate ensemble ice sheet model simulations. The challenge is to build a three-dimensional simulation of ice sheet evolution that is physically well-founded that satisfies most of the flow geometry changes, and fits within empirically defined ice marginal positions. ReferencesJohnson, M.D., Fredin, O., Ojala, A.E.K., Peterson, G., 2015: Unraveling Scandinavian geomorphology: the LiDAR revolution. GFF 137, 245-251.Hughes, A.L.C., Gyllencreutz, R., Lohne, Ø.S., Mangerud, J., Svendsen, J.I., 2016: The last Eurasian ice sheets--a chronological database and time-slice reconstruction, DATED-1. Boreas 45, 1–45.Winkelmann, R., Martin, M.A., Haseloff, M., Albrecht, T., Bueler, E., Khroulev, C., Levermann, A., 2011: The Potsdam parallel ice sheet model (PISM-PIK)--Part 1: Model description. The Cryosphere 5, 715–726.
Past ice flow direction can be inferred through mapping of subglacial lineations (e.g. drumlins and mega-scale glacial lineations). A numerical ice sheet model can also be used to reconstruct possible ice flow directions according to ice physics. These two methods are rarely integrated to see if the model can explain the observational data. Previous model-data comparison workflows made a large step forward. However, they lack statistical rigour and certain capabilities, such as comparing an ensemble of model simulations. To overcome these challenges, we created the Likelihood of Accordant Lineations Analysis (LALA) tool. LALA is a tool to compare numerical model ice sheet simulations to observational data of past flow direction. LALA was created to take a step forward in improving model-data comparisons; making comparisons statistically rigorous and adding the ability to directly grade multiple simulations against each other, a feature that was missing from previous tools. For this poster, we show an example of the tool in action and use LALA to compare model simulations of the British-Irish ice sheet and observations of flow direction from subglacial lineations taken from the BRITICE-CHRONO project. We present the best and the worst fitting simulations according to LALA. We also dissect the score produced to give an indication of the flow directions which are most (and least) regularly matched by the numerical modelling. These results highlight opportunities for model development and the potential to reevaluate observations.
Corridors of fast ice flow, ice streams, dominate the mass discharge of contemporary ice sheets. Ice streams are points of vulnerability for ice sheet instabilities, and so to understand past and future ice sheet change we need to understand ice stream behaviour. Computer simulations can replicate the position and magnitude of palaeo and contemporary ice streams with some skill, but for accurate future projections of ice mass change we need confidence that simulated ice streams will evolve and adjust to a retreating ice sheet in a realistic manner. This is much harder to constrain with empirical evidence, and there is still considerable uncertainty regarding ice stream response to changes in wider ice sheet geometry. To explore the behaviour of simulated ice streams on a fundamental level, we run simulations of a circular ice sheet on a flat bed using the BISICLES numerical ice sheet model. We simulate a series of idealised circular ice sheets of various radii, finding that plausible ice stream spacing and magnitude is simulated even on a flat bed, and that ice stream size and frequency scales with ice volume. We apply the idealised model to the bed of the Last Glacial Maximum Icelandic Ice Sheet, resulting in a simulation with less frequent ice streams, each with a greater size than would be expected based on the idealised case. The realistic topography makes ice stream position broadly insensitive to changes in topographic roughness and geothermal heat flux. These simulations provide increased confidence in the ability of ice sheet models to simulate dynamic ice stream change and could act as a starting point for more realistic simulations of the advance and retreat of the last Icelandic Ice Sheet.
In August 2023, South America experienced one of the most extreme heatwave events ever recorded, marking the warmest start to August in 117 years with temperature anomalies 10–20°C above the seasonal average. The heatwave impacted parts of Chile, northern Argentina, and southwestern Brazil, with temperatures in the Chilean Andes surpassing 38°C. Remote sensing images revealed widespread snowmelt across the Andes, and observations also suggested significant impacts on hydrological patterns, including spikes in winter runoff, affecting downstream water availability. Snow and glaciers in the Andes are essential reservoirs that sustain water supplies for millions of people. Winter plays a pivotal role in snowpack formation, which is crucial for the long-term stability of these resources. Extreme heatwave events during winter disrupt these processes, accelerating glacier retreat and snowmelt. This not only threatens water availability for agriculture, hydropower, and human consumption but also alters critical hydrological and ecological systems.This study performs the first dedicated attribution on the 2023 unprecedented winter heatwave in the Andes, with a novel multi-method approach, combining 1) circulation analogue method, 2) statistical attribution method, and 3) physical-based storyline approach through a set of convective-permitting scale (4-km resolution) regional model simulations (CPRCM) over the Andes, to unpack the roles played by the blocking anticyclone, developing El Niño in the Pacific Ocean that year, and anthropogenic greenhouse gas emissions. The study leverages existing multiple global model simulations from Coupled Model Intercomparison Project Phase 6, a set of model simulations from the Large Ensemble Community Project, and the CPRCM simulations run in-house. Here we present initial findings from this attribution study on the attributed contributions from the different drivers to the spatial extent, intensity, and duration of the heatwave, as well as results on the changing frequency of occurrences between the current and pre-industrial climates using the large ensembles.As global temperatures continue to rise, extreme winter heatwaves like this are projected to become more frequent, with profound consequences for snowpack dynamics and glacier stability in the Andes. This extraordinary winter heatwave serves as a stark reminder of the accelerating effects of climate change and the urgent need for adaptive strategies to protect critical Andean water systems.
Understanding how regime shifts in iceberg calving behavior affect ice shelf stability remains a challenge for numerical models. This is an important question as we consider the fate of the ice shelves that currently buttress the Antarctic Ice Sheet and hold back the bulk of its potential upstream sea-level contribution. Using buried landforms, we demonstrate that ice shelves fringed the former British-Irish Ice Sheet (BIIS) and document their disintegration ~18,000 years ago. The ice shelves produced massive (5–10 s km wide, 50–180 m thick) tabular icebergs until widespread ice shelf break-up shifted the calving regime to smaller bergs; a change that coincided with the collapse of marine-based ice across the central North Sea. We propose that the BIIS reached a climatic threshold around 18 ka which caused massive surface melting of its ice shelves, triggering hydrofracturing of crevasses that ultimately led to their disintegration and likely enhanced ice-retreat rates.
Loss of glacier ice is contributing substantially to rising sea levels, and is negatively impacting up to 1.9 billion people globally who rely on meltwater for agriculture, drinking water, hydropower and other ecosystem services. Quantifying how glaciers are responding to ongoing climate change therefore has far-reaching implications, though a global observational assessment of this at an individual glacier scale is currently lacking. Here, we leverage the Randolph Glacier Inventory v7.0 (RGI) dataset (baseline date: 2000), and imagery from the Sentinel-2 archive between 2020 and 2024 to establish the change in extent of the 181,402 small ice masses (area
 Chris Clark合作论文数School of Geography and Planning, University of Sheffield58
 Matteo Spagnolo合作论文数Geography & Environment Department, University of Aberdeen30
 Stephen Livingstone合作论文数Department of Geography, Faculty of Social Sciences, The University of Sheffield19
 Anna L. C. Hughes合作论文数Dept Earth Sci, Univ Bergen18
 Chris R. Stokes (Chris Stokes)合作论文数Department of Geography, Durham University13Sarah Bradley合作论文数Department of Geography, Faculty of Social Sciences, The University of Sheffield11
 Niall Gandy合作论文数School of Earth and Environment, University of Leeds10
 David Small合作论文数Department of Geography, Faculty of Social Sciences & Health, Durham University10
 Lauren Jenna Gregoire合作论文数10
 Brice R. Rea合作论文数School of Geosciences, University of Aberdeen10
 Mark Bateman合作论文数School of Geography and Planning, University of Sheffield10
 Iestyn D. Barr合作论文数Department of Geography, University of Sheffield10
 Owen King合作论文数Univ St Andrews, Sch Geog & Sustainable Dev, St Andrews, Fife, Scotland8
 Frances Butcher合作论文数Department of Geography, Faculty of Social Sciences, The University of Sheffield8
 Alicia Medialdea合作论文数Instituto de Estructura de la Materia, C.S.I.C.8
 Derek Fabel合作论文数Scottish Universities Environmental Research Centre8Peter A. Tuckett合作论文数Department of Geography, The University of Sheffield7
 Edward C. King合作论文数Substance Abuse and Mental Health Services Administration;Lewin Group;Actuarial Research Corporation;Substance Abuse and Mental Health Services Administration, Actuarial Research Corporation7
 Jonathan Carrivick合作论文数School of Geography, University of Leeds;Faculty of Environment, University of Leeds7
 Richard Chiverrell合作论文数Department of Geography and Planning, School of Environmental Sciences, Faculty of Science and Engineering, University of Liverpool7
 Wouter Buytaert合作论文数Imperial College London7
 Ramon Pellitero合作论文数Facultad de Filosofía y Letras, Universidad de Valladolid7
 Bethan Joan Davies合作论文数Science Laboratories, Durham University7
 Richard Hindmarsh合作论文数British Antarctic Survey;Department of Geography, Durham University7Andrew Sole合作论文数Department of Geography, Faculty of Social Sciences, The University of Sheffield7
 David Evans合作论文数Department of Geography, Durham University7David H. Roberts合作论文数6
 Tom Matthews合作论文数Dept Geog & Environm, Loughborough Univ6Steven G. Moreton合作论文数6
 Julie Jones合作论文数Department of Geography, Faculty of Social Sciences, The University of Sheffield6
 Juan Luis Garcia合作论文数Instituto de Geografía, Pontificia Universidad Católica de Chile5
 Fabian Drenkhan合作论文数Dept Civil & Environm Engn, Imperial Coll London5
 Julian A. Dowdeswell合作论文数Scott Polar Research Institute, Department of Geography, University of Cambridge;Jesus College, University of Cambridge5Kelly A. Hogan合作论文数Dept. of Chemical and Biological Sciences, University of Huddersfield5
 Tom Bradwell合作论文数British Geological Survey, Murchison House5
 Ian S. Evans合作论文数Department of Geography;Durham University;Department of Geography, Durham University5
 Sarah Greenwood合作论文数Department of Physical Geography and Quaternary Geology, Stockholm University5
 Nico Dewald合作论文数4
 Jonathan Kingslake合作论文数Columbia Univ, Lamont Doherty Earth Observ, Palisades, NY 10964 USA4
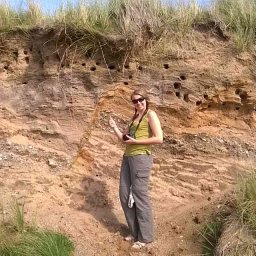 Rachel Smedley合作论文数School of Environmental Sciences, University of Liverpool4
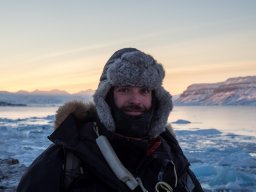 Robert McNabb合作论文数School of Geography and Environmental Sciences, Ulster University4
 James M. Lea合作论文数School of Environmental Sciences, University of Liverpool, Liverpool, UK4
 Xavier Pellicer合作论文数4
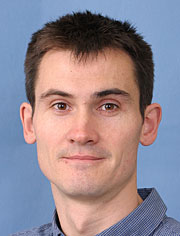 Colm Ó Cofaigh合作论文数Department of Geography, Durham University4Jan A. Piotrowski合作论文数Department of Earth Sciences, University of Aarhus4
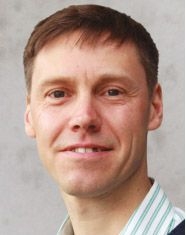 Geoff Duller合作论文数Department of Geography and Earth Sciences, Aberystwyth University4
 Alastair G C Graham合作论文数Coll Life & Environm Sci, Univ Exeter4
 S. Louise Callard合作论文数School of Geography, Environment & Earth Sciences, Victoria University of Wellington4




