Nearly half of the Oregon coast is comprised of dune-backed beaches, and these foredunes serve as protective features against coastal flood hazards. However, the ability of Oregon’s coastal dunes to protect against tsunami inundation is poorly understood due to existing inundation modeling that assumes static bathymetry. With an estimated 20
Sandy beaches act as buffers against various coastal hazards but are vulnerable to episodic (seasonal) and chronic (interannual) erosion. Understanding the variation of shoreline position, a key metric in coastal morphology, over a spectrum of time scales is therefore crucial in assessing hazard vulnerability. Long-standing research has investigated the role of El Niño-Southern Oscillation (ENSO), the dominant mode of climate variability in the Pacific Basin, in seasonal shoreline variability. Yet, ENSO's chronic influence-and that of another Pacific climate mode, the Pacific Decadal Oscillation (PDO)-on shoreline anomalies remains poorly understood. Here, we examine the variability of sandy beaches in the US Pacific Northwest, a ∼750 km long coastal region on the US West Coast. We leverage 40 years (1984-2024) of shoreline data from publicly available Earth-observing (Landsat) satellite imagery at a high spatial resolution (>10,000 shore-normal transects at 50-m alongshore spacing) and employ Convergent Cross Mapping (CCM), a methodology for inferring causality in dynamical systems. We discover that strong El Niño years are signified by erosion (75.1% of transects), and strong La Niña years exhibit accretional behavior (73.4% of transects). Furthermore, we establish, for the first time, that both ENSO and PDO exert a statistically significant control on interannual shoreline variability, particularly on the alongshore component (in 95 and 100% of littoral cells, respectively), with water level fluctuations playing a critical role. This effort advances our understanding of the seasonal-to-interannual interactions between Pacific Basin climate variability and the PNW's coastal morphodynamics, with implications for sediment management and coastal adaptation.
On the U.S. Pacific Northwest (PNW) outer coast, there are both naturally occurring dune backed beaches and cliff backed cobble beaches that have inspired nature- based engineering strategies for erosion control (i.e., sandy and vegetated dunes and dynamic revetments). Coastal communities want to mitigate and/or manage sand movement now, so policy and regulatory-based agencies are seeking the best available knowledge regarding the ecosystem services and dynamics associated with coastal foredune and cobble berms. Management needs and gaps in scientific knowledge and engineering practice often go hand in hand. Therefore we are working to develop guidance documents that combine management needs with the best available engineering and scientific knowledge to identify, synthesize, and address community-driven priorities for coastal dunes and dynamic cobble revetments in the PNW.
When the next great Cascadia Subduction Zone earthquake and tsunami occur, coastal residents and visitors will have 10-30 minutes to reach safety. Evacuation on foot will be the only means possible. To be prepared, people need answers to questions: what are the most efficient roads and trails to take to reach safety; how fast will people have to travel to beat the wave to safety; will the earthquake cause bridges to become impassable or activate a landslide that blocks an escape route, and if evacuation isn't feasible, what other preparations can be made? Beat the Wave is a tsunami pedestrian evacuation analysis designed to answer these questions and foster the development of community-specific mitigation efforts ranging from clear and visible signage placed in key locations to the construction of a tsunami vertical evacuation structure. Model data and results were originally orientated towards county emergency managers, city officials, fire and police chiefs, local planning and public works departments. Although these data are publicly accessible through the Oregon Department of Geology and Mineral Industries (DOGAMI), the format of the reports and accompanying geospatial data are not ideal for public use. In 2018, DOGAMI collaborated with the InfoGraphics Lab from the Univ. of Oregon to develop a Beat the Wave evacuation brochure for public use. In 2019, we continued this collaboration with the ability to automatically generate evacuation routes from any location within the tsunami zone via the NANOOS web portal and smartphone app. While considerable outreach has been done, much work remains to both maintain and improve public awareness of the hazard, especially the thousands of visitors to the Oregon coast. An essentially “forever” outreach and education program must be sustained to achieve the needed instinctive response and to assist local communities in developing mitigation actions and strategies. It is our intent that Beat The Wave contribute to this campaign in a meaningful way.
Many landslides cause destruction through progressive, gradual movements that stem from precipitation and toe erosion caused by marine or riverine processes. The magnitude and timing of seasonal landslide movement may be influenced by changing slide mass geometry and pore pressure response. The rate of landslide advance and potential for sustained movement has previously been studied in the context of hydrological factors, such as dilative or contractive pore pressure response, but the sensitivity of realistic landslide geometry subject to toe erosion is not well quantified. The purpose of this study is to assess the sensitivity of landslide movements to seasonal pore pressure increases and erosive processes. This assessment is performed through the development of a limit equilibrium framework couples time-dependent feedback between coulomb friction, pore pressure, and evolving landslide geometry. This enables quantification of the relative influence of time-dependent changes in pore pressure and rates of toe undercutting on landslide advance. The proposed model shows good agreement with monitoring data from three landslides in coastal Oregon, USA. Sensitivity to erosion, pore pressure, and geometry are assessed. Although fluctuations in pore pressures are found to be the primary driver for landslide movements at the sites, there is significant, nonlinear sensitivity to plausible erosion rates. This sensitivity is particularly apparent for landslides that tend to be short in length as the removal of buttressing materials is proportionally more destabilizing. These findings are an important consideration, particularly as increasingly extreme storm events that will likely magnify landslide movements in coastal or fluvial environments.
Over the past few decades coastal regions have experienced considerable socio-economic change. Accompanying these socio-economic shifts are unprecedented environmental changes, which include variation in magnitude and frequency of extreme weather events, marine heatwaves, increased ocean acidification, expansion of dead zones, extreme harmful algal blooms, and accelerating sea level rise. To understand these emerging environmental shifts, the past two decades have witnessed increased capacity to monitor changing environmental conditions and predict with greater accuracy such variations and events. These observation and prediction systems produce ever increasing amounts of data. Ongoing efforts to deliver this information using standard data models, metadata, data access protocols, and community accepted data server applications have helped reduce the heterogeneity of these data and improved data distribution. However, delivering critical information to stakeholders in a user-friendly and accessible manner remains a challenge. Beginning in 2009, the Northwest Association of Networked Ocean Observing Systems (NANOOS), the U.S. Integrated Ocean Observing System (IOOS) regional association for the Pacific Northwest, began to address this challenge by developing the NANOOS Visualization System (NVS), a map-based platform that aggregated a multitude of diverse data sets and forecast model fields into one system with the goal of delivering a more seamless, one-stop-shopping experience for users of coastal, ocean and atmospheric data. Here we describe the early vision and development of NVS and how it evolved into a flexible, multi-application platform where customized web applications can be developed to meet the needs of specific stakeholder groups. We focus on three applications (Seacast, Shellfish Growers, and Tsunami Evacuation Zones) that were developed using more formal design processes in close coordination with commercial crab fishermen, shellfish growers, and state and local emergency managers. In addition, we briefly describe the Tuna Fishers application, which evolved out of informal discussions with recreational tuna fishers. In highlighting these applications, we demonstrate the flexibility of NVS to quickly spin up prototype applications using pre-existing NVS framework elements. Working closely with small groups of dedicated stakeholders, we are then able to refine and extend an application before releasing it to the broader audience. Such a capability has enabled NANOOS to truly meet stakeholder needs, while increasing user capacity to understand and better respond to ongoing regional environmental changes.
This correction stands to correct Figure 7c listing a low minimum slip of 12 m for Case 2 instead of the correct value of 8 m, as stated in the body of the text and depicted on the chart of cumulative slip. The corrected chart explanation and caption are shown below. This error did not affect any of the findings of the paper or the chart itself. This is a correction to the original article.
Recent tsunamis affecting the West Coast of the USA have resulted in significant damage to ports and harbors, as well as to recreational and commercial vessels attempting to escape the tsunami. With the completion of tsunami inundation simulations for a distant tsunami originating from the Aleutian Islands and a locally generated tsunami on the Cascadia subduction zone (CSZ), the State of Oregon is now able to provide guidance on the magnitudes and directions of the simulated currents for the Oregon coast and shelf region. Our analyses indicate that first wave arrivals for an Aleutian Island event would take place on the north coast, ~ 3 h 40 min after the start of the earthquake, ~ 20 min later on the southern Oregon coast. The simulations demonstrated significant along-coast variability in both the tsunamis water levels and currents, caused by localized bathymetric effects (e.g., submarine banks and reefs). A locally generated CSZ event would reach the open coast within 7–13 min; maximum inundation occurs at ~ 30–40 min. As the tsunami current velocities increase, the potential for damage in ports and harbors correspondingly increases, while also affecting a vessels ability to maintain control out on the ocean. Scientific consensus suggests that tsunami currents < 1.54 m/s are unlikely to impact maritime safety in ports and harbors. No such guidance is available for boats operating on the ocean, though studies undertaken in Japan suggest that velocities in the region of 1–2 m/s may be damaging to boats. In addition to the effects of currents, there is the added potential for wave amplification of locally generated wind waves interacting with opposing tsunami currents in the offshore. Our analyses explore potential wave amplification effects for a range of generic sea states, ultimately producing a nomogram of wave amplification for a range of wave and opposing current conditions. These data will be useful for US Coast Guard and Port authorities as they evaluate maritime tsunami evacuation options for the Oregon coast. Finally, we identify three regions of hazard (high, moderate, and low) across the Oregon shelf, which can be used to help guide final designation of tsunami maritime evacuation zones for the coast.
A recent 35‐year endpoint shoreline change analysis revealed significant counterclockwise rotations occurring in north‐central Oregon, USA, littoral cells that extend 10s of kilometers in length. While the potential for severe El Niños to contribute to littoral cell rotations at seasonal to interannual scale was previously recognized, the dynamics resulting in persistent (multidecadal) rotation were unknown, largely due to a lack of historical wave conditions extending back multiple decades and the difficulty of separating the timescales of shoreline variability in a high energy region. This study addresses this question by (1) developing a statistical downscaling framework to characterize wave conditions relevant for longshore sediment transport during data‐poor decades and (2) applying a one‐line shoreline change model to quantitatively assess the potential for such large embayed beaches to rotate. A climate INdex was optimized to capture variability in longshore wave power as a proxy for potential LOngshore Sediment Transport (LOST_IN), and a procedure was developed to simulate many realizations of potential wave conditions from the index. Waves were transformed dynamically with Simulating Waves Nearshore to the nearshore as inputs to a one‐line model that revealed shoreline rotations of embayed beaches at multiple time and spatial scales not previously discernible from infrequent observations. Model results indicate that littoral cells respond to both interannual and multidecadal oscillations, producing comparable shoreline excursions to extreme El Niño winters. The technique quantitatively relates morphodynamic forcing to specific climate patterns and has the potential to better identify and quantify coastal variability on timescales relevant to a changing climate.
The El Niño-Southern Oscillation is the dominant mode of interannual climate variability across the Pacific Ocean basin, with influence on the global climate. The two end members of the cycle, El Niño and La Niña, force anomalous oceanographic conditions and coastal response along the Pacific margin, exposing many heavily populated regions to increased coastal flooding and erosion hazards. However, a quantitative record of coastal impacts is spatially limited and temporally restricted to only the most recent events. Here we report on the oceanographic forcing and coastal response of the 2015–2016 El Niño, one of the strongest of the last 145 years. We show that winter wave energy equalled or exceeded measured historical maxima across the US West Coast, corresponding to anomalously large beach erosion across the region. Shorelines in many areas retreated beyond previously measured landward extremes, particularly along the sediment-starved California coast.
On 20 May, a destructive landslide, later coined Arleen's Slide, occurred in California's iconic Big Sur region, completely burying more than half a kilometer of State Highway 1 ([ 1 ][1], [ 2 ][2]). In the 4 previous months, more than 150 cm of winter rain in Big Sur alone ([ 2 ][2]) saturated
We present model results derived from a tsunami current benchmarking workshop held by the NTHMP (National Tsunami Hazard Mitigation Program) in February 2015. Modeling was undertaken using our own 3D unstructured-grid model that has been previously certified by the NTHMP for tsunami inundation. Results for two benchmark tests are described here, including: (1) vortex structure in the wake of a submerged shoal and (2) impact of tsunami waves on Hilo Harbor in the 2011 Tohoku event. The modeled current velocities are compared with available lab and field data. We demonstrate that the model is able to accurately capture the velocity field in the two benchmark tests; in particular, the 3D model gives a much more accurate wake structure than the 2D model for the first test, with the root-mean-square error and mean bias no more than 2 cm s −1 and 8 mm s −1 , respectively, for the modeled velocity.
To predict future coastal hazards, it is important to quantify any links between climate drivers and spatial patterns of coastal change. However, most studies of future coastal vulnerability do not account for the dynamic components of coastal water levels during storms, notably wave-driven processes, storm surges and seasonal water level anomalies, although these components can add metres to water levels during extreme events. Here we synthesize multi-decadal, co-located data assimilated between 1979 and 2012 that describe wave climate, local water levels and coastal change for 48 beaches throughout the Pacific Ocean basin. We find that observed coastal erosion across the Pacific varies most closely with El Niño/Southern Oscillation, with a smaller influence from the Southern Annular Mode and the Pacific North American pattern. In the northern and southern Pacific Ocean, regional wave and water level anomalies are significantly correlated to a suite of climate indices, particularly during boreal winter; conditions in the northeast Pacific Ocean are often opposite to those in the western and southern Pacific. We conclude that, if projections for an increasing frequency of extreme El Niño and La Niña events over the twenty-first century are confirmed, then populated regions on opposite sides of the Pacific Ocean basin could be alternately exposed to extreme coastal erosion and flooding, independent of sea-level rise. The dynamic components of coastal water level can add metres to water levels during extreme events. A data synthesis reveals that Pacific regional wave and water level fluctuations are closely related to the El Niño/Southern Oscillation.
 Peter Ruggiero合作论文数Department of Ecology26
 Paul D. Komar (Paul Komar)合作论文数College of Oceanic & Atmospheric Sciences, Oregon State University25
 George M. Kaminsky合作论文数Department of Ecology10George R. Priest合作论文数Oregon Department of Geology and Mineral Industries, Newport Coastal Field Office10Stephen E. Dickenson合作论文数4heather m baron合作论文数4Patrick Corcoran合作论文数4Yinglong ZHANG (张应龙)合作论文数4Roger Hart合作论文数4
 Robert C. Witter合作论文数Oregon Department of Geology and Mineral Industries, Newport Coastal Field Office4
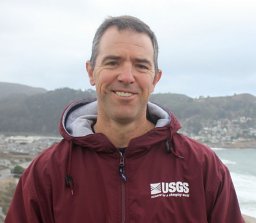 Patrick L. Barnard合作论文数United States Geological Survey, Pacific Science Center4André Doria合作论文数4
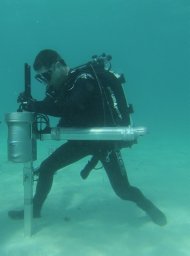 Jeff E. Hansen合作论文数Pacific Coastal and Marine Science Center, University of California,4
 Sean Vitousek合作论文数Department of Geology and Geophysics4Alan Niem合作论文数3Laura Gabel合作论文数3Troy Tanner合作论文数3Jan A Newton合作论文数3Daniel Hoover合作论文数3
 Nathan J. Wood合作论文数Dept . of Geosciences;Oregon State Univ;Dept . of Geosciences, Oregon State Univ3
 Craig M. Risien合作论文数3
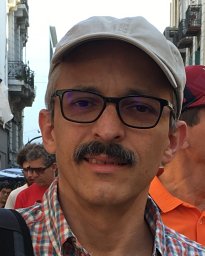 Emilio Mayorga合作论文数Institute of Marine and Coastal Sciences, The State University of New Jersey3
 Gary Griggs合作论文数Division of Applied Sciences, University of California3w a niem合作论文数2Curran Mohney合作论文数2Laura Stimely合作论文数2Weiner, Heather M.合作论文数2
 Diana Mccandless合作论文数2Michael Bunn合作论文数2deborah a reusser合作论文数2Wendy A. Niem合作论文数2
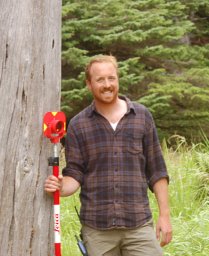 D. Heathfield合作论文数Hakai Inst2Mohsen Taherkhani合作论文数2
 Matt S. OBanion合作论文数Dept Geog & Environm Engn, US Mil Acad2Alex Snyder合作论文数2
 Dylan L. Anderson合作论文数Oregon State Univ, Coll Engn, Corvallis, OR 97331 USA2
 Masayuki Banno合作论文数Port & Airport Res Inst, Natl Inst Maritime Port & Aviat Technol2
 Nicholas Cohn合作论文数Oregon State Univ, Coll Earth Ocean & Atmospher Sci, Corvallis, OR 97331 USA2
 Timu Gallien合作论文数Civil and Environmental Engineering Department, School of Engineering, University of California, Los Angeles2
 Ian Walker合作论文数Department of Earth, Environmental and Geographic Sciences, Irving K. Barber Faculty of Science, The University of British Columbia2
 Mitchell Dean Harley合作论文数School of Civil & Environmental Engineering, Faculty of Engineering, The University of New South Wales2
 Kelin Wang合作论文数Sidney Subdivision, Pacific Division, Geological Survey of Canada;Pacific Geoscience Centre;Natural Resources Canada2Andrew Short合作论文数Faculty of Science, The University of Sydney2
 Wayne J. Stephenson合作论文数Department of Geography;University of Melbourne;Department of Geography, University of Melbourne2
 Peter N. Adams合作论文数University of Florida2
 Ian Turner合作论文数Coastal Engineering at the Water Research Laboratory, School of Civil & Environmental Engineering, Faculty of Engineering, The University of New South Wales;NSW Department of Planning and Environment2
 Karin R. Bryan合作论文数Department of Earth and Ocean Sciences, University of Waikato2
 Andrew D Ashton合作论文数Geology and Geophysics Department, Woods Hole Oceanographic Institution2
 Yoshiaki Kuriyama合作论文数Littoral Drift Division;Airport Research Institute2




