The dry matter and NPK accumlation charts from the classic series, How a Corn Plant Develops, were the bases for the dominant thinking on seasonal nutrient accumulation and nutrient partitioning into various plant parts into the first decade of the 21st century. Were they still accurate for modern hybrids? Earn 0.5 CEUs in Crop Management by reading this article and taking the quiz at www.certifiedcropadviser.org/education/classroom/classes/624.
Studies are limited that focus on change in concentration and accumulation of secondary and micronutrients in corn (Zea mays L.) plant fractions and across corn hybrid development periods. This research was conducted in 2007 and 2008 to evaluate the partitioning of secondary and micronutrients across vegetative and reproductive stages at the plant-fraction level for 1960- and 2000-era hybrids. Two popular hybrids for each era were grown, with measurement of nutrient concentration and content in several plant and grain fractions. Secondary and micronutrient concentrations in plant fractions were lower in 2000- than 1960-era hybrids with most nutrients, except ear shoots and tassels for certain nutrients. However, nutrient content was consistently greater in 2000-compared to 1960-era hybrids in the whole plant and fractions at most development stages, except tassels and ear shoots. In tassels, nutrient content was mostly smaller in 2000-era hybrids, but in ear shoots content was similar. The accumulation rates of most nutrients per growing degree day (GDD) were greater in the reproductive period for 2000-era hybrids, but similar among eras in the vegetative period. Remobilized nutrients from vegetative to reproductive components were similar between era hybrids, except Ca and Fe, and positive except Fe, Mn, and B. It is apparent that greater nutrient content in newer hybrids was driven mainly by associated nutrient uptake rates and greater dry matter (DM). Despite the greater nutrient content with the modern hybrids, removal with grain or stover harvest would still be small for S and micronutrients.
As corn (Zea mays L.) hybrids change over time, and with increased use of different plant components for feed, bedding, and energy production, it is important to know macronutrient distribution within plants and how nutrient concentration and accumulation varies during plant development. This field study was conducted in 2007 and 2008 to evaluate dry matter (DM) biomass, macronutrient concentration, and macronutrient content in corn plant fractions (stalk, leaf, tassel, ear shoot, cob, and grain) across developmental stages with two hybrids from 1960 and 2000 eras. Concentrations of N, P, and K were generally lower in all plant fractions for the 2000 compared to 1960 era hybrids, except P concentration in stalks and grain and K concentration in leaves and ear shoots. In contrast, N, P, and K content was consistently higher in 2000 era hybrids for whole plants, leaves, and grain; a reflection of greater DM production. Nitrogen, P, K, and DM content in tassels was lower for 2000 than 1960 era hybrids. From the 1960s to 2000s, hybrid development brought about an increase in plant biomass and grain yield resulting in greater total nutrient content. However, macronutrient concentrations in vegetative plant fractions and grain decreased, thus moderating increase in plant total and grain nutrient content. This research shows the importance for analysis of newer hybrid vegetative and grain biomass on an ongoing basis to provide reliable estimates of macronutrient uptake patterns and removal with harvest of specific vegetative material and grain.
Core Ideas Evaluating corn dry matter and macronutrient accumulation patterns across era hybrids is necessary to understand changes in plant nutrient requirements and effects on accumulation timing and fertilization management. Era hybrids differed in dry matter and nutrient accumulation, with differences in nutrient content mainly related to dry matter production. Dry matter and P accumulation was linear, however, N and K accumulation slowed during the reproductive stages. Although the absolute dry matter production and nutrient content was greater with the most recent hybrids, relative to the maximum dry matter and N, P, and K content and the accumulation rate (cumulative growing degree unit‐based) remained the same across era hybrids. Results indicate that overall dry matter production and yield potential has been mainly responsible for changes in corn macronutrient requirements with development of new hybrids. Evaluating corn ( Zea mays L.) aboveground dry matter (DM) and macronutrient accumulation patterns across era hybrids is necessary to understand changes in plant nutrient requirements and effects on accumulation timing and fertilization management. Two popular hybrids for each of five era‐decades from 1960 to 2000 were grown in 2007 and 2008. Whole plant samples were collected at 10 development stages, with dry matter (DM), N, P, and K determined. Era hybrids differed in DM and nutrient accumulation, with differences in nutrient content mainly related to DM production. The 1960 to 1990 era hybrids were more similar in DM and nutrient content across development stages compared to the 2000 era hybrids which had the greatest content. Dry matter and P accumulation was linear (V6–R5 stages), however, N and K accumulation slowed during the reproductive stages. While the fraction of maximum plant content at R1 averaged 48, 71, 58, and 83% across hybrids for DM, N, P, and K, respectively; the ranges were 43 to 52% for DM (1990 and 1960), 64 to 78% for N (1990 and 1960), 55 to 60% for P (2000 and1960), and 69 to 93% for K (1990 and 1960). Although the absolute DM production and nutrient content was greater with the most recent hybrids, relative to the maximum DM, N, P, and K content and the accumulation rate, growing degree unit based, remained the same across era hybrids. This indicates that overall DM production and yield potential has been mainly responsible for changes in corn macronutrient requirements with development of new hybrids.
Core Ideas Corn stover has many uses, including recent interest for cellulosic bioenergy production. For corn stover use in ethanol production, an increased understanding is needed of plant component biomass and N content within a stover harvest system, and the impact on N cycling and corn N use. Improving N use efficiency in corn is important for optimizing yield and reducing environmental impacts. Corn (Zea mays L.) stover has become an important commodity for many uses, including cellulosic ethanol production. However, there are concerns about the impacts of aggressive stover removal at the industrial scale. The objective of this study was to evaluate the effect of continuous stover removal (SR) on plant component productivity, N uptake, and nitrogen use efficiency (NUE). Treatments were none, partial, and complete SR, no‐till (NT) and chisel plow (CP), and 0, 168, and 280 kg N ha−1 rates. Total plant, vegetative, grain, and cob dry matter (DM) increased with SR (5.2–7.5%), but no difference was detected between partial and complete removal and there were no interactions with tillage system or N rate. Chisel plow and N application increased total and plant component DM, with the same overall effect on plant components from tillage as occurred with SR. Grain harvest index (GHI) was not influenced by SR (mean of 51% with N application). Stover removal had little effect on NUE measures, with only partial factor productivity (PFP), total production efficiency (TPE), and system efficiency (SYE) increasing with SR. Increasing N rate decreased NUE, with no differential effect from SR or tillage system. Stover removal in this continuous corn system provided a soil environment conducive to increased overall productivity, plant N uptake, and NUE; with a similar effect with CP compared to NT. Nitrogen management will need to account for specific biomass removal because corn production level and N removal can be differentially affected by plant component harvest.
Core Ideas Three distinct site‐groupings resulted, with different recommended planting windows. Two planting windows were developed for each site‐grouping: 98–100% grain yield or 95–100% grain yield. The north‐central and northeast grouping had the earliest recommended planting window to maximize grain yield. Farmers use a suite of management practices to optimize corn (Zea mays L.) grain yield, including planting at appropriate times for their location. Research on planting dates across the years has tended to use categorical analysis and determination of recommendations by identifying a particular calendar date as optimum and setting yield decline relative to that. This approach was suitable given the experimental designs and number of sites available for analyses. An 18 site‐year Iowa dataset, however, that was constructed with planting dates on a sliding scale allowed regression analysis to be used instead of categorical analysis. This approach resulted in the construction of planting‐date recommendations as a window of time. Three distinct site‐groupings resulted for Iowa, which is different than previous statewide research: north‐central (NC) and northeast (NE); northwest (NW) and central (C); and southwest (SW) and southeast (SE). Two planting windows were developed for each site‐group based on the maximum yield on the response curve and a subtraction of 2 or 5% relative yield to develop yield windows of 98–100% or 95–100%, respectively. The response curves for each site‐grouping identify locations that exhibit a stronger grain‐yield response to planting date, especially in the northern and southern locations. The NC–NE grouping had the earliest 98–100% planting window (12–30 April) whereas the NW–C grouping (15 April–9 May) and SW–SE grouping (17 April–8 May) were later.
Winter rye (Secale cereale L.) cover crop (RCC) use in corn (Zea mays L.) and soybean [Glycine max. (L.) Merr.] production can alter N dynamics compared to no RCC. The objectives of this study were to evaluate RCC biomass production (BP) and subsequent RCC degradation (BD) and N recycling in a no‐till corn–soybean (CS) rotation. Aboveground RCC was sampled at spring termination for biomass dry matter (DM), C, and N. To evaluate BD and remaining C and N, RCC biomass was put into nylon mesh bags, placed on the soil surface, and collected multiple times over 105 d. Treatments included rye cover crop following soybean (RCC‐FS) and corn (RCC‐FC), and prior‐year N applied to corn. Overall, the RCC BP and N was low due to low soil profile NO3–N. Across sites and years, the greatest BP was with RCC‐FC that received 225 kg N ha−1 (1280 kg DM ha−1), with similar N uptake as with RCC‐FS (27 kg N ha−1). The RCC biomass and N remaining decreased over time following an exponential decay. An average 62% biomass with RCC‐FS and RCC‐FC degraded after 105 d; however, N recycled was greater with RCC‐FS than RCC‐FC [22 (80%) vs. 14 (64%) kg N ha−1, respectively], and was influenced by the RCC C/N ratio. The RCC did not recycle an agronomically meaningful amount of N, which limited N that could potentially be supplied to corn. Rye cover crops can conserve soil N, and with improved management and growth, recycling of crop‐available N should increase.
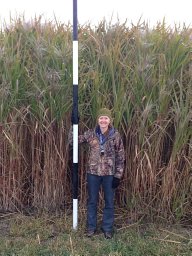
Replacing annual row crops with perennial grasses for bioenergy represents a landscape-level change in species composition, with the potential to impact annual soil nutrient removal on a regional scale. In this study we measured the concentration of ten essential nutrients in harvested material from three potential perennial bioenergy crops: Panicum virgatum L., Miscanthus × giganteus, and a reestablished prairie to determine annual soil nutrient removals. We compared perennial bioenergy crops to nutrient removals by annual cropping systems of Zea mays L. (maize) and Glycine max L. (soybean) in Illinois. Crops were grown under management practices typical for the Midwest, US. In addition, we examined geographic variation in nutrient removal of M. × giganteus at four US locations. Total removal of N, P, K, Ca, Mg, S, Fe, Mn, Na, and Zn was significantly greater in maize than in any of the perennials. Removal of N, P, and K in M. × giganteus was 3.7, 1.8, and 1.8% of the removal in maize, and 49.0, 17.4, and 31.9% of the removal in soybean respectively. At sites in Illinois, Kentucky, Nebraska, and New Jersey we found differences in N and K removal by M. × giganteus that corresponded with differences in biomass. There was no effect of fertilization on M. × giganteus biomass, but removal of N, S, and Mg increased and P removal decreased with increasing rates of urea fertilization. Cultivation of M. × giganteus and switchgrass on land formerly used for row crops may reduce the need for nutrient additions and potential losses of nutrients to groundwater and the atmosphere.
A soil incubation study was conducted to evaluate the effect of winter cereal rye (Secale cereale L.) cover crop (CC) biomass and fertilizer nitrogen (N) addition on soil inorganic-N. Rye aboveground biomass was collected following corn (Zea mays L.) and soybean [Glycine max (L.) Merr.], and incubated at equivalent field temperatures for 105d at rates of 1120, 2240, and 3360kg dry matter (DM) ha(-1). Despite N addition from the rye biomass at any rate, there was no real effect on ammonium (NH4)-N, and only from 63d to 105d a limited net increase in nitrate (NO3)-N and inorganic-N was observed compared to no-rye. Nitrate-N and inorganic-N concentrations change per heat unit (HU) accumulation was negative with rye addition through 7d, but was positive consistently across the remaining incubation period with or without rye. Overall, the rye CC biomass had only a neutral to small positive effect on soil inorganic-N.
Corn ( Zea mays L.) N use is of continued interest due to agronomic performance and environmental issues. This 2‐yr study evaluated era hybrid response to fertilizer nitrogen (FN) rate in a factorial arrangement of one popular hybrid per five decades (1960–2000 eras) and five N rates (0–224 kg N ha −1 ). An additional hybrid per era was grown at 168 kg N ha −1 . Hybrid productivity and nitrogen use efficiency (NUE) increased across the eras, but not between the 1980 and 1990 eras. Grain yield (GY) increased 65% and total plant biomass 43%, however, total plant nitrogen uptake (PNU) increased only 19% and across N rates was only higher for the 2000 era. At the agronomic optimum nitrogen rate (AONR), there was a linear GY increase of 0.13 Mg ha −1 yr −1 and GY N response of 0.091 Mg ha −1 yr −1 , indicating considerable genetic gain. There was no trend in AONR across eras. For plant N status measures, SPAD readings decreased and canopy index values increased across eras. All NUE measures indicated significant improvement in NUE. The apparent nitrogen recovery efficiency (NRE) at N rates near the AONR of each era, however, was not highest for the most recent eras. Harvest index (HI), grain nitrogen harvest index (GNHI), and fraction of total PNU accumulated by R1 were the same among eras. The grain nitrogen concentration (GNC), however, was 24% lower for the 2000 compared to the 1960 era. Corn hybrid development across the 50‐yr period improved productivity and NUE, but not the AONR.
Winter rye (Secale cereale L.) cover crop (RCC) has potential to reduce NO3–N loss from corn (Zea mays L.) and soybean [Glycine max (L.) Merr.] fields. However, RCC effects on annual crop productivity and corn optimal N fertilization requirement are unclear. The objectives were to evaluate corn and soybean yield response to RCC and corn optimal N rate. Treatments were no-RCC and RCC with six fertilizer N rates (0–225 kg N ha-1) applied to corn in a no-till corn–soybean (CS) rotation at four Iowa sites in 2009 through 2011. The RCC biomass and N uptake was low, with a maximum of 1280 kg dry matter (DM) ha-1 and 26 kg N ha-1, respectively. In the no-N control, the RCC reduced soil profile NO3–N by 15 kg N ha-1 only at time of RCC control before corn planting. Corn canopy sensing, plant height, and plant population indicated more N stress, reduced plant stand, and slower growth with RCC. The RCC reduced corn grain yield by 6% at the economic optimum N rate (EONR). The EONR was the same with no-RCC and RCC, but plant N uptake efficiency (PUE) was reduced at low N rates with RCC, but not above the EONR. Soybean yield was not affected by RCC. Results indicate N fertilization rate should be the same with or without RCC. Improvement in RCC systems and management could make RCC a more viable practice within no-till corn and soybean production.
The study was conducted in the Shibetsu River watershed (SRW), Hokkaido, Japan, in order to examine the possibility of using the soil and water assessment tool (SWAT) to provide an understanding of sediment and particulate organic nitrogen (PON) and particulate organic phosphorous (POP) yields between 2003 and 2008. The SRW is a non-conservative catchment (the surface catchment lying on a continuous impervious horizon) and it is recognized that it receives external groundwater (EXT) from other watersheds. The EXT yield from each hydrologic response unit (HRU) was added to streamflow in the SWAT model. Simulated daily sediment and PON and POP yields from the SWAT model showed a strong agreement with the observed values. The simulated annual sediment yield ranged from 5 to 45 tonnes.km−2.yr−1 (annual mean of 24 tonnes.km−2.yr−1). Annual PON yield ranged from 0.1 to 0.3 tonnes.km−2.yr−1 (annual mean of 0.18 tonnes.km−2.yr−1). Annual POP yield ranged from 0.01 to 0.03 tonnes.km−2.yr−1 (annual mean of 0.02 tonnes.km−2.yr−1). Snowfall, snowmelt and rainfall seasons contributed about 10, 20 and 70% respectively to total sediment and associated PON and POP yields. The SWAT model identified that sub-basins located in the upper part of the watershed were critical source area of land surface erosion. This research demonstrates the ability of the SWAT model to estimate sediment and associated PON and POP yields, and to improve the understanding of soil erosion mechanisms at catchment scale receiving external water.
An on‐farm study was conducted in Iowa from 2004 to 2006 at 18 sites to evaluate corn ( Zea mays L.) grain yield (GY) and soil‐ and plant‐test responses to poultry manure (PM) nutrient application at the field scale. A control and two target PM rates based on total N (PM‐N) were applied in randomized field‐length strips with three replications. Corn GY responded positively to PM applications. While N, P, and K plant and soil tests were related to PM nutrient rates, there was considerable variation, and relationships were probably influenced by the multiple applied nutrients. Soil‐test P and soil‐test K across sites increased linearly with increasing PM total P and K rates and with large increases from the high rates. This confirms high P and K crop availability. Grain yield responses to PM decreased linearly with increasing leaf chlorophyll meter (CM) and late spring soil NO 3 –N test (LSNT) values but were not related to end‐of‐season lower corn stalk NO 3 –N test values. No N test had a plateau relationship with GY, suggesting no excess N supply despite large PM‐N rates. This confirms low first‐year PM‐N availability. The relationship between CM and LSNT indicated a critical LSNT value at 24 mg kg −1 , similar to that from previous small‐plot research. This field‐scale study showed that PM is a valuable nutrient resource. However, due to PM multinutrient content and differences in availability, the nutrient causing GY and plant‐ or soil‐test results often cannot be clearly identified and results need careful interpretation for reliable use.
Demand for corn (Zea mays L.) stover is increasing for livestock and bioenergy production. Excessive stover harvest (SH) could impact crop productivity and soil N cycling. A 3-yr study was conducted at two Iowa sites with continuous corn to determine the effect of SH level and tillage system on grain yield, response to N fertilization, and optimal N rate. Treatments were none, partial, and complete SH, chisel plow tillage and recently implemented no-till, and six N rates from 0 to 280 kg N ha−1. Profile soil NO3–N concentration (with no fertilizer N) increased slightly from spring preplant to early June only with no SH but were the same with all SH levels after corn harvest. Corn canopy normalized difference vegetative index (NDVI) values were greatest with both SH levels and chisel plow. Increases in NDVI due to SH was less with chisel plow than no-till. Corn grain yield was 9% (0.84 Mg ha−1) greater with chisel plow than with no-till. At the economic optimum N rate (EONR), grain yield was not influenced by SH with chisel plow but was 6% greater with each SH level under no-till. The EONR was the same with both tillage systems but was 22 and 45 kg N ha−1 lower with partial and complete SH, respectively, than no SH. Results of this study indicate the potential for increased corn yield with SH in a no-till system and a reduced fertilizer N rate requirement with SH regardless of tillage system.
It is difficult to investigate the factors that control the riverine nitrate-nitrogen (NO3--N) export in a watershed which gains or losses groundwater. To control the NO3--N contamination in these watersheds, it is necessary to investigate the factors that are related to the export of NO3--N that is only produced by the watershed itself. This study was conducted in the Shibetsu watershed located in eastern Hokkaido, Japan, which gains external groundwater contribution (ExT) and 34 % of the annual NO3--N loading occurs through EXT. The riverine NO3--N exports from 1980 to 2009 were simulated by the SWAT model, and the factors controlling the temporal and spatial patterns of NO3--N exports were investigated without considering the EXT. The results show that hydrological events control NO3--N export at the seasonal scale, while the hydrological and biogeochemical processes are likely to control NO3--N export at the annual scale. There was an integrated effect among the land use, topography, and soil type related to denitrification process, that regulated the spatial patterns of NO3--N export. The spatial distribution of NO3--N export from hydrologic response units (HRUs) identified the agricultural areas with surplus N that are vulnerable to nitrate contamination, A new standard for the N fertilizer application rate including manure application should be given to control riverine NO3--N export. This study demonstrates that applying the SWAT model is an appropriate method to determine the temporal and spatial patterns of NO3--N export from the watershed which includes EXT and to identify the crucial pollution areas within a watershed in which the management practices can be improved to more effectively control NO3--N export to water bodies.
The response of corn (Zea mays L.) grain yield (GY) to plant population or seeding rate is well studied. Population recommendations have been previously made by amassing numerous data points to find the optimum plant population. However, the response has not yet been linked with the corn suitability rating (CSR), a measure of soil productivity. We evaluated the effect of seeding rate with respect to the CSR system on corn GY. The study was performed across 33 site‐years in Iowa from 2006 to 2009. Seeding rates ranged from 49,400 to 118,560 seeds ha−1. Two versions of CSR were examined—the original CSR and the revised CSR2. Averaged across all site‐years, corn GY showed a quadratic response to the seeding rate. Predicted corn GY was maximized at 13.4 Mg ha−1 with the seeding rate of 96,000 ha−1. Corn GY plateaued for the highest CSR class, had significant quadratic responses to second and third CSR classes, but did not respond to seeding rate at the lowest CSR class. However, corn GY did not plateau for the highest CSR2 class as in the CSR. Although all three lower CSR2 classes responded quadratically, there was no clear pattern. Generally, the predicted corn GY also responded quadratically to seeding rate with respect to the parameters used for calculating CSR2 values. Because the original CSR values incorporate climatic conditions and predicted more realistic corn GY responses to seeding rate in this study, we recommend using CSR values when estimating the optimum seeding rate to maximize corn GY.
Anhydrous ammonia (AA) is an important N fertilizer in the United States, and with large farming operations rapid application is needed. This study evaluated the impact of AA application timing and N rates when applied with a high speed low draft (HSLD) or aconventional till knife injection (CTKI) on corn (Zea mays L.) production in no‐tillage fields. The study was conducted at sites located in Illinois, Iowa, and Kansas from 2007 to 2009. The experimental design was a split‐plot factorial arrangement of application method, timing (fall; spring pre‐plant, SP; and sidedress, SD), and five N rates. Fall AA application was least efficient (mean 55 kg N ha−1 higher optimum N and 2% lower grain yield, GY), with SP and SD equivalent. The HSLD was comparable to the CTKI with most applications, except when high N rates (180 and 225 kg N ha−1) were applied SP. For these treatments AA injury reduced plant population (PP), early season growth, canopy normalized difference vegetative index (NDVI), and GY. Seedling injury did not occur with any N rate or timing with the CTKI. Shallow AA placement at high speed with the HSLD can provide a viable alternative to traditional deeper knife injection when conditions are suitable for AA application and positioning avoids corn seedling injury. Anhydrous ammonia application with the HSLD, however, should be avoided where high SP AA rates may be placed directly under future corn rows.
Investigating factors controlling the temporal patterns of nitrogen (N) and dissolved organic carbon (DOC) exports on the basis of a comparative study of different land uses is beneficial for managing water resources, especially in agricultural watersheds. We focused our research on an agricultural watershed (AW) and a forested watershed (FW) located in the Shibetsu watershed of eastern Hokkaido, Japan, to investigate the temporal patterns of N and DOC exports and factors controlling those patterns at different timescales (inter-annual, seasonal, and hydrological event scales). Results showed that the annual patterns of N and DOC exports significantly varied over time and were probably controlled by climate. Higher discharge volumes in 2003, a wet year, showed higher N and DOC loadings in both watersheds. However, this process was also regulated by land use associated with N inputs. Higher concentrations and loadings were shown in the agricultural watershed. At the seasonal scale, N and DOC exports in the AW and the FW were more likely controlled by sources associated with land use. The Total N (TN) and Nitrate-N (NO3- -N) had higher concentrations during snowmelt season in the AW, which may be attributed to manure application in late autumn or early winter in the agricultural watershed. Concentrations of TN, NO3--N, dissolved organic nitrogen (DON), and DOC showed higher values during the summer rainy season in the FW, related to higher litter decomposition during summer and autumn and the fertilizer application in the agricultural area during summer. Higher DOC concentrations and loadings were observed during the rainy season in the AW, which is probably attributed to higher DOC production related to temperature and microbial activity during summer and autumn in grasslands. Correlations between discharge and concentrations differed during different periods or in different watersheds, suggesting that weather discharge can adequately represent the fact that N export depends on N concentrations, discharge level, and other factors. The differing correlations between N/DOC concentrations and the Si concentration indicated that the N/DOC exports might occur along different flow paths during different periods. During baseflow, the high NO3--N exports were probably derived from deep groundwater and might have percolated from uplands during hydrological events. During hydrological events, NO3--N exports may occur along near-surface flow paths and in deep groundwater, whereas DOC exports could be related to near-surface flow paths. At the event scale, the relationships between discharge and concentrations of N and DOC were regulated by antecedent soil moisture (shallow groundwater condition) in each watershed. These results indicated that factors controlling N and DOC exports varied at different timescales in the Shibetsu area and that better management of manure application during winter in agricultural lands is urgently needed to control water pollution in streams. Copyright (C) 2013 John Wiley & Sons, Ltd.
Liquid swine (Sus scrofa domesticus) manure (LSM) is a valuable source of plant nutrients; however, information on application to soybean [Glycine max (L.) Merr.] and subsequent potential N response in residual-year corn (Zea mays L.) is lacking. Replicated on-farm trials were conducted at eight sites from 2000 to 2003 in Iowa with control, low, and high LSM application rates applied to soybean. In the following year corn, four fertilizer N (FN) rates were applied within each prior-year LSM rate. Soybean grain yield (GY) increased at 63% of sites with LSM application (mean 0.17 Mg ha−1), with no soybean GY reductions. Postsoybean harvest soil profile NO3–N increased at four sites, with mean increases across sites of 12 and 24 kg NO3–N ha−1 for the low and high LSM rates, respectively. Residual-year corn GY increased at 71% of sites from the prior-year low and high LSM rates (mean 0.6 and 1.1 Mg ha−1) that received no FN. The residual-year N supply to corn was estimated at 11% of the total LSM-N applied to soybean, the amount of postsoybean harvest profile NO3–N ha−1 increase from each LSM rate. Corn leaf relative chlorophyll meter (RCM) and end of season corn stalk NO3–N (CSNT) reflected the residual N supply, but the late spring nitrate test (LSNT) did not detect that residual N. Application of LSM to soybean can be a viable nutrient management practice; however, total-N application should be at a rate to minimize excessive residual NO3–N and carryover to future crops.
Liquid swine (Sus scrofa) manure (LSM) is a substantial crop nutrient resource in Iowa. An on‐farm study was conducted in 2000–2003 at 16 sites to evaluate corn (Zea mays L.) response to LSM N. Replicated field‐length strips were a control and two LSM rates, fall or spring applied, and four fertilizer N (FN) rates applied after planting in subplots. Average corn grain yield (GY) in the strips was 7.8, 9.6, and 10.4 Mg ha−1 for the control, low, and high LSM rates, respectively. Plant and soil tests also increased with LSM application, indicating corn response. With the low LSM rate, GY increased with FN at many sites, but less frequent and smaller increase with the high LSM rate. Despite the average 82% fraction of LSM total‐N as NH4–N, FN equivalence based on GY was only 61 to 64%. This indicates potential N losses, not unexpected due to application time and large springtime precipitation at some sites. Critical values for the late spring soil NO3–N (LSNT) and lower corn stalk NO3–N (CSNT) were 27 and 1820 mg NO3–N kg−1, respectively; and the tests consistently indicated excess N but had poor relationship to N response at low values. Relative chlorophyll meter (RCM) values did not differentiate excess to slight N deficiency. The LSM was able to supply N for corn production, but like fertilizer, must be managed carefully. If additional N may be needed to achieve optimal yield, application must be based on well‐calibrated soil or plant tests.
 Ryusuke Hatano合作论文数Graduate School of Agriculture;Hokkaido University;Graduate School of Agriculture, Hokkaido University27
 Kanta Kuramochi合作论文数18Atsushi Hayakawa合作论文数16
 John E. Sawyer合作论文数Department of Agronomy, Iowa State University14Toshiyuki Nagumo合作论文数12Mariko Shimizu合作论文数Cancer Research Center of Hawaii, University of Hawaii at Manoa11
 Daniel Barker合作论文数8Roger W. Elmore合作论文数7
 Lori J. Abendroth合作论文数6
 Jose L. Pantoja合作论文数5Matthew J. Boyer合作论文数4
 Mark B. David合作论文数Department of Natural Resources & Environmental Sciences, College of Agricultural, Consumer and Environmental Sciences, University of Illinois Urbana-Champaign4liang lie合作论文数3Corey A. Mitchell合作论文数3
 Wang Chunying (王春颖)合作论文数2
 Sudipta Rakshit合作论文数University of Central Florida2John P. Lundvall合作论文数2
 Robert G. Darmody合作论文数Department of Natural Resources and Environmental Science, University of Illinois at Urbana-Champaign2
 T. B. Voigt合作论文数Dept Crop Sci, Univ Illinois2Christopher K. Black合作论文数1Anthony J.W. Myers合作论文数1n prakpongkep合作论文数1Candice M. Smith合作论文数1jenwei tsai合作论文数1
 Mahdi Al-Kaisi合作论文数1
 Kantola Ilsa B合作论文数1
 Ying Zhao (赵滢)合作论文数College of Horticulture, Northwest A&F University1
 Xiaomin Mao (毛晓敏)合作论文数College of Water Resources & Civil Engineering, China Agricultural University1
 Antonio P. Mallarino合作论文数Department of Agronomy, Iowa State University1
 Sabine Sauvage合作论文数ECOLAB, Université de Toulouse1Hiromu Imai合作论文数1Daniel E. Kaiser合作论文数Department of Agronomy;Iowa State University;Department of Agronomy, Iowa State University1
 Evan H Delucia合作论文数School of Integrative Biology, College of Liberal Arts & Sciences, University of Illinois Urbana-Champaign;Center for Global Studies, University of Illinois Urbana-Champaign;Carl R. Woese Institute for Genomic Biology, University of Illinois at Urbana-Champaign1
 Rui Jiang (姜锐)合作论文数School of Traffic and Transportation, Beijing Jiaotong University1
 Jose Miguel Sanchez Perez合作论文数1H.Mark Hanna合作论文数1
 C. Lee Burras合作论文数Department of Agronomy, Iowa State University1
 Dorivar Ruiz Diaz合作论文数1Teruo Ishiwata合作论文数1
 Michael Paul Masters合作论文数1David B. Mengel合作论文数1
 Richard Cooke合作论文数Department of Agricultural and Biological Engineering, College of Agricultural, Consumer and Environmental Sciences, University of Illinois at Urbana-Champaign1
 Fabian G. Fernandez合作论文数Department of Crop Sciences, University of Illinois1Koji Nomaru合作论文数1
 Gregory Mcisaac合作论文数Department of Natural Resources and Environmental Sciences, University of Illinois at Urbana-Champaign1




