The highly biologically productive northern California Current, which includes the Oregon continental shelf, is an archetypal eastern boundary region with summertime upwelling driven by prevailing equatorward winds and wintertime downwelling driven by prevailing poleward winds. Between 1960 and 1990, monitoring programs and process studies conducted off the central Oregon coast advanced the understanding of many oceanographic processes, including coastal trapped waves, seasonal upwelling and downwelling in eastern boundary upwelling systems, and seasonal variability of coastal currents. Starting in 1997, the U.S. Global Ocean Ecosystems Dynamics – Long Term Observational Program (GLOBEC-LTOP) continued those monitoring and process study efforts by conducting routine CTD (Conductivity, Temperature, and Depth) and biological sampling survey cruises along the Newport Hydrographic Line (NHL; 44.652°N, 124.1 – 124.65°W), located west of Newport, Oregon. Additionally, GLOBEC-LTOP maintained a mooring slightly south of the NHL, nominally at 44.64°N, 124.30°W, on the 81-meter isobath. This location is referred to as NH-10, as it is located 10 nautical miles or 18.5 km west of Newport. A mooring was first deployed at NH-10 in August 1997. This subsurface mooring collected water column velocity data using an upward-looking acoustic Doppler current profiler. A second mooring with a surface expression was deployed at NH-10 starting in April 1999. This mooring included velocity, temperature and conductivity measurements throughout the water column as well as meteorological measurements. GLOBEC-LTOP and the Oregon State University (OSU) National Oceanographic Partnership Program (NOPP) provided funding for the NH-10 moorings from August 1997 to December 2004. Since June 2006, the NH-10 site has been occupied by a series of moorings operated and maintained by OSU with funding from the Oregon Coastal Ocean Observing System (OrCOOS), the Northwest Association of Networked Ocean Observing Systems (NANOOS), the Center for Coastal Margin Observation & Prediction (CMOP), and most recently the Ocean Observatories Initiative (OOI). While the objectives of these programs differed, each program contributed to long-term observing efforts with moorings routinely measuring meteorological and physical oceanographic variables. This article provides a brief description of each of the six programs, their associated moorings at NH-10, and our efforts to combine over twenty years of temperature, practical salinity, and velocity data into one coherent, hourly averaged, quality-controlled data set. Additionally, the data set includes best-fit seasonal cycles calculated at a daily temporal resolution for each variable using harmonic analysis with a three-harmonic fit to the observations. The stitched together, hourly NH-10 time series and seasonal cycles are available via Zenodo at https://doi.org/10.5281/zenodo.7582475.
The annual abundance of the non-native European green crab, Carcinus maenas, in Oregon estuaries varies greatly with ocean conditions. Average numbers were high following the 1997-1998 El Nin similar to o, decreased and remained low ( 0.3 per trap) until they increased ( 2 per trap) following the extended anomalous warming in 2014-2016. The year class strength of young crabs is strongly linked to ocean indicators during their planktonic larval development. Many of the same physical and biological ecosystem indicators used in salmon forecasting are also correlated with green crabs, but in the opposite direction. While cold ocean conditions benefit salmon, warm ocean indicators are positively linked to green crab year class strength. Among the best indicators for green crab year class strength are winter water temperatures, the sign of the Pacific Decadal Oscillation index, the day of physical and biological spring transitions, and negative biomass anomalies of northern copepods. These correlations suggest that green crabs need (1) warm winters (temperature > 10 degrees C), which enable larvae to complete their development in the near-shore, (2) strong northward flow of coastal waters during winter, which allows larvae to be transported from established populations to the south and (3) coastal circulation patterns that keep larvae close to shore, where they can be carried by wind and tidal currents into estuaries to settle. By using a relatively simple stoplight approach of ranking indicators, we were able to explain 69% of the inter-annual variability in green crab year class strength, while a quantitative metric of a combination of indicators explained 64% of the variability. Recruitment in 2018 and 2019 exceeded what was expected from the suite of ocean indicators. We discuss the possible role of additional larval sources, from the north or from local estuaries, that may have contributed to the increased recruitment during these years. If breeding populations of green crabs in Oregon and Washington continue to build, the relationships between ocean conditions and recruitment we have developed based solely on larval sources from the south could be greatly underestimating recruitment in the future.
The ensemble four-dimensional variational (En4DVar) data assimilation (DA) system introduced in Part I (Pasmans and Kurapov, 2019) is tested in the coastal waters offshore Oregon and Washington, U.S. West coast, during the spring and summer of 2011. The background error covariance B is derived from the forecast ensemble. Satellite sea-surface temperature (SST), sea-surface height (SSH), and daily-averaged radial surface currents from high-frequency radars (HFRs) are assimilated. The performance of the En4DVar system is compared with a “traditional” 4DVAR system using a static B. It is found that the presence of the Columbia River plume has a profound impact on the ensemble B. Near the plume front the SST–SSS covariance can be up to a factor 20 larger in magnitude than in the static B. This introduces large spatial and temporal variability in the ensemble B. The En4DVar system is more successful than the 4DVAR with the static B preserving the temperature–salinity properties when compared to glider data. The En4DVar system also produces more accurate forecasts and analyses for temperature in the subsurface below 30 m at a buoy location on the continental shelf. In comparisons with other surface and subsurface observations En4DVar shows consistent, albeit not significant, improvement over traditional 4DVAR. Large surface temperature–salinity covariances in combination with the episodic occurrence of large-scale errors in the SST observations lead to erroneous freshening in the centre of the model domain. Adding constraints on the surface salinity corrections based on the prior model reduces this effect.
The ocean knows no political borders. Ocean processes, like summertime wind-driven upwelling, stretch thousands of kilometers along the Northeast Pacific (NEP) coast. This upwelling drives marine ecosystem productivity and is modulated by weather systems and seasonal to interdecadal ocean-atmosphere variability. Major ocean currents in the NEP transport water properties such as heat, fresh water, nutrients, dissolved oxygen, pCO(2), and pH close to the shore. The eastward North Pacific Current bifurcates offshore in the NEP, delivering open-ocean signals south into the California Current and north into the Gulf of Alaska. There is a large and growing number of NEP ocean observing elements operated by government agencies, Native American Tribes, First Nations groups, not-for-profit organizations, and private entities. Observing elements include moored and mobile platforms, shipboard repeat cruises, as well as land-based and estuarine stations. A wide range of multidisciplinary ocean sensors are deployed to track, for example, upwelling, downwelling, ocean productivity, harmful algal blooms, ocean acidification and hypoxia, seismic activity and tsunami wave propagation. Data delivery to shore and observatory controls are done through satellite and cell phone communication, and via seafloor cables. Remote sensing from satellites and land-based coastal radar provide broader spatial coverage, while numerical circulation and biogeochemical modeling complement ocean observing efforts. Models span from the deep ocean into the inland Salish Sea and estuaries. NEP ocean observing systems are used to understand regional processes and, together with numerical models, provide ocean forecasts. By sharing data, experiences and lessons learned, the regional ocean observatory is better than the sum of its parts.
Gliders are low-power autonomous underwater vehicles used to obtain oceanic measurements in vertical sections. Assimilation of glider temperature and salinity into coastal ocean circulation models holds the potential to improve the ocean subsurface structure estimate. In this study, the impact of assimilation of glider observations is studied using a four-dimensional variational (4DVAR) data assimilation and forecast system set offshore of Oregon and Washington on the U.S. West Coast. Four test cases are compared: (1) no assimilation, (2) assimilation of glider temperature and salinity data alone, (3) assimilation of the glider data in combination with the surface observations including satellite sea surface temperature, sea surface height, and high-frequency radar surface velocities, and (4) assimilation of the surface data alone. It is found that the assimilation of glider observations alone creates unphysical eddies in the vicinity of the glider transect. As a consequence, the forecast errors in the surface velocity and temperature increase compared to the case without data assimilation. Assimilation of surface and subsurface observations in combination prevents these features from forming and reduces the errors in the forecasts for the subsurface fields compared to the other three experiments. These improvements persisted in 21-day forecasts run after the last data assimilation cycle. Plain Language Summary Ocean forecast systems, like our system for the ocean offshore Oregon- Washington, USA, use numerical models to predict future temperature, currents, sea surface height, and salt concentration. Eventually, these predictions are corrected using observations in a process called data assimilation ( DA) in order to better approximate the true state of the ocean. Assimilation of subsurface observations made by autonomous underwater vehicles called gliders can potentially improve the predictions of the ocean state below the surface. In this study, we have assimilated glider observations together with, and in absence of, surface observations. We found that assimilation of glider observations alone creates predictions that are less accurate than those obtained from a model without DA as the DA creates unphysical features. Assimilating the glider observations in tandem with surface observations prevents these features from forming and realizes local improvements to the subsurface ocean predictions that last for 21 days after the last DA correction. These results show that one has to be careful with using glider observations in DA and should always assimilate glider observations in combination with observations that cover large swaths of the ocean surface.
Over the past few decades coastal regions have experienced considerable socio-economic change. Accompanying these socio-economic shifts are unprecedented environmental changes, which include variation in magnitude and frequency of extreme weather events, marine heatwaves, increased ocean acidification, expansion of dead zones, extreme harmful algal blooms, and accelerating sea level rise. To understand these emerging environmental shifts, the past two decades have witnessed increased capacity to monitor changing environmental conditions and predict with greater accuracy such variations and events. These observation and prediction systems produce ever increasing amounts of data. Ongoing efforts to deliver this information using standard data models, metadata, data access protocols, and community accepted data server applications have helped reduce the heterogeneity of these data and improved data distribution. However, delivering critical information to stakeholders in a user-friendly and accessible manner remains a challenge. Beginning in 2009, the Northwest Association of Networked Ocean Observing Systems (NANOOS), the U.S. Integrated Ocean Observing System (IOOS) regional association for the Pacific Northwest, began to address this challenge by developing the NANOOS Visualization System (NVS), a map-based platform that aggregated a multitude of diverse data sets and forecast model fields into one system with the goal of delivering a more seamless, one-stop-shopping experience for users of coastal, ocean and atmospheric data. Here we describe the early vision and development of NVS and how it evolved into a flexible, multi-application platform where customized web applications can be developed to meet the needs of specific stakeholder groups. We focus on three applications (Seacast, Shellfish Growers, and Tsunami Evacuation Zones) that were developed using more formal design processes in close coordination with commercial crab fishermen, shellfish growers, and state and local emergency managers. In addition, we briefly describe the Tuna Fishers application, which evolved out of informal discussions with recreational tuna fishers. In highlighting these applications, we demonstrate the flexibility of NVS to quickly spin up prototype applications using pre-existing NVS framework elements. Working closely with small groups of dedicated stakeholders, we are then able to refine and extend an application before releasing it to the broader audience. Such a capability has enabled NANOOS to truly meet stakeholder needs, while increasing user capacity to understand and better respond to ongoing regional environmental changes.
This paper addresses how well a two-dimensional orthogonal vector current field can be reconstructed from a set of nonorthogonally and irregularly sampled scalar velocity data. High-frequency radar (HFR)derived surface radial scalar velocities are sampled on a polar or elliptical coordinate grid as a directional projection of two-dimensional vector currents for a viewing angle of the individual HFRs. Synthetic radial velocity maps are generated by sampling two-dimensional surface vector currents obtained from a simple spectral model and a realistic regional circulation model on the polar or elliptical grid points configured similarly as the operational HFRs. Then, the sampled radial velocity maps are combined into a vector current field using inverse methods: least squares fitting and optimal interpolation. In this paper, uncertainty and misfit are defined as the degrees of insufficiency to resolve the vector current and the difference between the true and estimated vector currents, respectively. The uncertainty and misfit are evaluated in terms of several simulation parameters built into the simple spectral model and the degrees of the quality and the observational error of the radial velocity maps associated with the simulated missing data and noise level, respectively. A greater number of missing data and higher observational errors correspond to an increase in the standard deviation of the misfit and a significant reduction in the effective spatial coverage of the vector current fields. This paper provides technical details for resolving a vector current field and guidelines for the practical design of the spatial sampling of the current field using the HFRs.
This paper presents a least squares method to estimate the horizontal (isotropic or anisotropic) spatial covariance of two-dimensional orthogonal vector components, without introducing an intervening mapping step and biases, from the spatial covariance of the nonorthogonally and irregularly sampled raw scalar velocities. The field is assumed to be locally homogeneous in space and sampled in an ensemble so the unknown spatial covariance is a function of spatial lag only. The transformation between the irregular grid on which nonorthogonal scalar projections of the vector are sampled and the regular orthogonal grid on which they will be mapped is created using the geometry of the problem. The spatial covariance of the orthogonal velocity components of the field is parameterized by either the energy (power) spectrum in the wavenumber domain or the lagged covariance in the spatial domain. The energy spectrum is constrained to be nonnegative definite as part of the solution of the inverse problem. This approach is applied to three example sets of data, using nonorthogonally and irregularly sampled radial velocity data obtained from 1) a simple spectral model, 2) a regional numerical model, and 3) an array of high-frequency radars. In tests where the true covariance is known, the proposed direct approaches fitting to parameterization of the nonorthogonally and irregularly sampled raw data in the wavenumber domain and spatial domain outperform methods that map the data to a regular grid before estimating the covariance.
The purpose of Oregon's Nearshore Research Inventory (NRI) project was to understand the geographic use of ocean space by the marine science community in order to include the information in Oregon's marine spatial planning (MSP) process. Spatial data and attributes about the geographic use of Oregon's ocean and coast by marine scientists were inventoried and mapped; including information about the geographic distribution of research, research timelines, and the people and institutions that conduct scientific research. The results of the NRI interviews show that the scientific community conducts research in twenty percent of the nearshore grid cells used in the Oregon's Territorial Sea amendment process. These results show that ocean space is used by the scientific community, and therefore, should be recognized as a use of ocean space in the MSP process.As new uses, such as wave energy extraction, are proposed along coastlines and in the ocean, MSP can be used as a tool to reduce conflict and find compatible uses of ocean and coastal space. A major benefit of the scientific community's use of ocean and coastal space is that it results in data that can be used to inform ecosystem-based management decisions. Interruptions in long-term scientific research and monitoring as a result of ocean space use conflicts could limit the availability of information for use in future management decisions. While considering tradeoffs in the MSP process, decision makers need to recognize and account for the value of scientific space as a use of the ocean. (C) 2016 Published by Elsevier Ltd.
Moored sensors were maintained for approximate to 5 years on the northern California Current System (CCS) midshelf. The alongcoast sensor array spanned the area of influence of the plume from the Columbia River, several submarine canyons, as well as a coastal promontory where the equatorward coastal jet frequently separates from the shelf. Upwelling-favorable wind stress magnitude decreases poleward by more than a factor of three over the latitudinal range and shelf width varies by a factor of two. In spite of the alongcoast structure in setting, both seasonal and interannual patterns in subsurface layer water properties were remarkably similar at all sites. Higher in the water column, freshwater forcing was substantial. Because of the near surface freshwater input, seasonal sea surface and subsurface temperatures were almost perfectly out of phase in the northernmost CCS, with a mid water column inversion in winter. Year to year differences in subsurface layer wintertime water properties were similar to spatial and temporal patterns of wind stress variability: little alongcoast structure except in salinity, but pronounced interannual differences strongly related to local wind stress. Summertime wind and subsurface property patterns were the opposite of those in winter: pronounced alongcoast wind stress structure, but little or no alongcoast or interannual variability in water properties, and only a weak relationship to local wind stress. Summertime interannual water property variability, including source waters, was shown to be more consistent with remote forcing via larger scale wind stress rather than with local wind stress, particularly in the northernmost CCS.
The purpose of Oregon’s Nearshore Research Inventory (NRI) project was to understand the geographic use of ocean space by the marine science community in order to include the information in Oregon’s marine spatial planning (MSP) process. Spatial data and attributes about the geographic use of Oregon’s ocean and coast by marine scientists were inventoried and mapped; including information about the geographic distribution of research, research timelines, and the people and institutions that conduct scientific research. The results of the NRI interviews show that the scientific community conducts research in twenty percent of the nearshore grid cells used in the Oregon’s Territorial Sea amendment process. These results show that ocean space is used by the scientific community, and therefore, should be recognized as a use of ocean space in the MSP process. As new uses, such as wave energy extraction, are proposed along coastlines and in the ocean, MSP can be used as a tool to reduce conflict and find compatible uses of ocean and coastal space. A major benefit of the scientific community’s use of ocean and coastal space is that it results in data that can be used to inform ecosystem-based management decisions. Interruptions in long-term scientific research and monitoring as a result of ocean space use conflicts could limit the availability of information for use in future management decisions. While considering tradeoffs in the MSP process, decision makers need to recognize and account for the value of scientific space as a use of the ocean. © 2016 Published by Elsevier Ltd.
From mid-May to August 2011, extreme runoff in the Columbia River ranged from 14,000 to over 17,000 m3/s, more than two standard deviations above the mean for this period. The extreme runoff was the direct result of both melting of anomalously high snowpack and rainfall associated with the 2010–2011 La Niña. The effects of this increased freshwater discharge were observed off Newport, Oregon, 180 km south of the Columbia River mouth. Salinity values as low as 22, nine standard deviations below the climatological value for this period, were registered at the mid-shelf. Using a network of ocean observing sensors and platforms, it was possible to capture the onshore advection of the Columbia River plume from the mid-shelf, 20 km offshore, to the coast and eventually into Yaquina Bay (Newport) during a sustained wind reversal event. Increased freshwater delivery can influence coastal ocean ecosystems and delivery of offshore, river-influenced water may influence estuarine biogeochemistry.
A 2-km horizontal resolution ocean circulation model is developed for a large coastal region along the US Pacific Northwest (34–50N) to study how continental shelf, slope, and interior ocean variability influence each other. The model has been run for the time period September 2008–May 2011, driven by realistic surface momentum and heat fluxes obtained from an atmospheric model and lateral boundary conditions obtained from nesting in a global ocean model. The solution compares favorably to satellite measurements of sea surface temperature and sea surface height, observations of surface currents by high-frequency radars, mooring temperature time series, and glider temperature and salinity sections. The analysis is focused on the seasonal response of the coastal ocean with particular emphasis on the winter circulation patterns which have previously garnered relatively little attention. Interannual variability is examined through a comparison of the 2009–2010 winter influenced by El Niño and the winters in the preceding and following years. Strong northward winds combined with reduced surface cooling along the coast north of Cape Mendocino (40.4N) in winter 2009–2010, resulting in a vigorous downwelling season, characterized by relatively energetic northward currents and warmer ocean temperatures over the continental shelf and upper slope. An analysis of the time variability of the volume-averaged temperature and salinity in a coastal control volume (CV), that extends from 41 to 47N and offshore from the coast to the 200-m isobath, clearly shows relevant integrated characteristics of the annual cycle and the transitions between winter shelf circulation forced by northward winds and the summer circulation driven primarily by southward, upwelling-favorable winds. The analysis also reveals interesting interannual differences in these characteristics. In particular, the CV volume-average temperature remains notably warmer during January–March 2010 of the El Niño winter.
An introduced population of European green crabs Carcinus maenas was established in San Francisco Bay (California, USA) prior to 1989. Subsequently, their larvae were likely carried northward into the embayments of Oregon, Washington (USA), and British Columbia (Canada) by the unusually strong Davidson Current during the winter of the El Nino of 1997-1998. Since this colonizing event, green crabs in Oregon and Washington have persisted at low densities. In this study, we show that after the arrival of the strong founding year-class of 1998, significant recruitment to the Oregon and Washington populations has occurred, but only in 2003, 2005, 2006 and 2010. Warm winter water temperatures, high positive values of the Pacific Decadal Oscillation (PDO) and Multivariate ENSO (El Nino Southern Oscillation) indices in March, weak southward shelf currents in March and April, a late biological spring transition, and high abundance of subtropical copepods are all strongly correlated with strong year-classes. We hypothesize that northward transport of larvae from California by coastal currents during warm winters is the mechanism by which the larvae are delivered to the Pacific Northwest. Among the best indicators of northward flow (and green crab recruitment) were the date of 'biological spring transition', the sign of the PDO, and the biomass of southern copepod species, which indicate (1) stronger northward flow of coastal waters during winters, (2) relatively warm winters (sea surface temperature >10 degrees C), which enable larvae to complete their development in the near-shore, and (3) coastal circulation patterns that may keep larvae close to shore, where they can be carried by tidal currents into estuaries to settle.
The influence of varying horizontal and vertical stratification in the upper layer ( O(10) m) associated with riverine waters and seasonal atmospheric fluxes on coastal near-inertial currents is investigated with remotely sensed and in situ observations of surface and subsurface currents and realistic numerical model outputs off the coast of Oregon. Based on numerical simulations with and without the Columbia River (CR) during summer, the directly wind-forced near-inertial surface currents are enhanced by 30%–60% when the near-surface layer has a stratified condition due to riverine water inputs from the CR. Comparing model results without the CR for summer and winter conditions indicates that the directly wind-forced near-inertial surface current response to a unit wind forcing during summer are 20%–70% stronger than those during winter depending on the cross-shore location, which is in contrast to the seasonal patterns of both mixed-layer depth and amplitudes of near-inertial currents. The model simulations are used to examine aspects of coastal inhibition of near-inertial currents, manifested in their spatial coherence in the cross-shore direction, where the phase propagates upward over the continental shelf, bounces at the coast, and continues increasing upward offshore (toward surface) and then downward offshore at the surface, with magnitudes and length scales in the near-surface layer increasing offshore. This pattern exhibits a particularly well-organized structure during winter. Similarly, the raypaths of clockwise near-inertial internal waves are consistent with the phase propagation of coherence, showing the influence of upper layer stratification and coastal inhibition.
 Adriana Huyer (Jane)合作论文数College of Earth, Ocean, and Atmospheric Sciences, Oregon State University55
 John A. Barth合作论文数College of Earth, Ocean, and Atmospheric Sciences, Oregon State University;Studies Initiative, Oregon State University38
 Jane Fleischbein合作论文数29
 Robert L. Smith合作论文数Department of Industrial and Operations Engineering, College of Engineering, University of Michigan25Alexander L. Kurapov合作论文数24William T. Peterson合作论文数22
 Patricia A. Wheeler (Patricia Wheeler)合作论文数College of Earth, Ocean, and Atmospheric Sciences, Oregon State University22
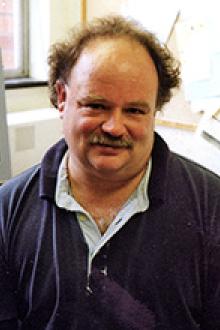 Gary Egbert合作论文数College of Earth, Ocean, and Atmospheric Sciences, Oregon State University20Murray D. Levine合作论文数20global ocean ecosystems dynamics合作论文数14Jack A. Barth合作论文数13J. S. Allen合作论文数12
 Barbara Hickey合作论文数School of Oceanography, College of the Environment, University of Washington12R. Kipp Shearman合作论文数College of Oceanic and Atmospheric Sciences, Oregon State University12Timothy J Boyd合作论文数11
 Evelyn Sherr合作论文数College of Earth, Ocean, and Atmospheric Sciences, Oregon State University11
 Barry F. Sherr合作论文数11P. Ted Strub合作论文数College of Oceanic;Atmospheric Sciences;Oregon State University;College of Oceanic|Atmospheric Sciences, Oregon State University11
 Stephen D. Pierce合作论文数College of Oceanic and Atmospheric Sciences, Oregon State University11Robert N. Miller合作论文数10
 Sung Yong Kim合作论文数Department of Mechanical Engineering, College of Engineering, Korea Advanced Institute of Science and Technology9
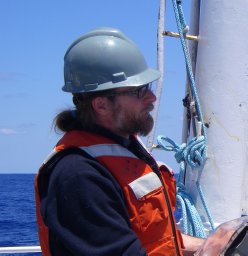 Jody Michael Klymak合作论文数College of Oceanic;Atmospheric Sciences;Oregon State University;College of Oceanic|Atmospheric Sciences, Oregon State University9Timothy J. Boyd合作论文数8J Fleischbein合作论文数7
 Craig M. Risien合作论文数7
 A Perlin合作论文数College of Oceanic;Atmospheric Sciences;Oregon State University;College of Oceanic|Atmospheric Sciences, Oregon State University7
 Libe Washburn合作论文数Ocean Physics Group, University of Southern California7William Peterson合作论文数6
 Parker MacCready合作论文数School of Oceanography, University of Washington6
 Bruce D. Cornuelle合作论文数Scripps Institution of Oceanography|University of California , San Diego6
 Neil S Banas合作论文数School of Oceanography;University of Washington;School of Oceanography, University of Washington6
 James N Moum (James Moum)合作论文数College of Earth, Ocean, and Atmospheric Sciences, Oregon State University6Edward P. Dever合作论文数6
 Timothy J. Cowles合作论文数6John Osborne合作论文数US Naval Res Lab5Franklin B. Schwing合作论文数NOAA Fisheries5
 Jeffrey D. Paduan合作论文数Department of Oceanography, Naval Postgraduate School5
 John L. Largier合作论文数Bodega Marine Laboratory, Department of Environmental Science and Policy, College of Agricultural and Environmental Sciences, University of California Davis5S. R. Ramp合作论文数5
 Roger Lukas合作论文数Department of Oceanography, University of Hawaii at Manoa5
 Mark Ohman合作论文数Integrative Oceanography Division, Scripps Institution of Oceanography, University of California, San Diego5steve r gard合作论文数4richard e schramm合作论文数4smith robert l合作论文数4
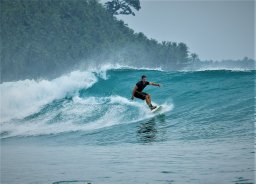 Eric Terrill合作论文数Marine Physical Laboratory;Scripps Institution of Oceanography;University of California , San Diego;Scripps Institution of Oceanography, University of California , San Diego4Eric D. Barton合作论文数4
 Christopher D. Wilson合作论文数4Burt Jones合作论文数4Peter Hacker合作论文数4




