Abstract Amplified Arctic warming is reducing sea ice cover, which is driving an increase in geopolitical interest in the region as it offers the possibility of reducing shipping times between Asia, Europe, and eastern North America, at the risk of increased ice hazards. Here, we examine the case of the Norseman II research ship that was trapped by sea ice in the southern Chukchi Sea for 14 days in June 2024. This is the first study of its sort in this region. We show that anomalously thick and extensive sea ice was present north of the region prior to the event, and that strong northerly winds in early June advected this ice southward, trapping the ship. Later in June, southerly winds advected ice northwards away from the ship, helping to free it. We further show that the event was forecastable.
Ocean observation buoys are currently powered-constrained by battery storage capacity or available solar power. Power constraints limit the number of measurements that can be made and the lifetime of the buoys. Ocean surface wave energy could be used for power production, but wave energy converters are not yet commercially available for ocean observation buoys. Here we present the design and testing of a drifting wave energy converter buoy using a pendulum transmission system (PTS). The wave energy converter buoy was designed to operate in Arctic temperatures and wave conditions, but it could be used in areas with warmer temperatures and larger waves. Field tests measured a maximum power production of 5 watts in waves with a significant wave height of 0.42 meters and a ten minute average power production of 37 milliwatts. Power production increased with the energy period and significant wave height. The energy harvesting capabilities of the PTS showed the utility of adding a wave energy conversion device to a drifting ocean observation buoy.
Abstract David Andrew (Drew) Rothrock III lived during a period of vigorous scientific research in the Earth Sciences, from the International Geophysical Year to the era of satellites and high‐speed computer modeling. Drew made fundamental contributions to Arctic science, helping to lay the theoretical foundations for modeling the movement and thickness of sea ice, and later championing the acquisition and use of satellite and submarine data to test and improve those models, and to quantify changes in sea‐ice thickness over time. He was a founding member of the Polar Science Center at the University of Washington in Seattle, where he led major research projects, contributed his expertise to agency panels and working groups, and launched the careers of young scientists through his mentorship.
As part of the SASSIE (Salinity and Stratification at the Sea Ice Edge) program in the Beaufort Sea, we examined scale-dependent spatial differences of surface temperature (SST) and salinity (SSS) in the late melting/early freezing season of 2022. The scales examined were between 50 m and 20 km. The differences were measured using a ”salinity snake”, an underway system deployed from a research vessel to measure temperature and salinity of the near surface layer. Using the ship’s S-band radar, we differentiated between times when the ship was in the marginal ice zone (MIZ) and when it was in nearby open water. Differences were also computed for the transit leg of the expedition, well away from the ice. We find that differences depend strongly on the scale at which they are measured: the larger the scale, the larger the median difference (as expected from theory). Differences also depend on whether they are measured within the MIZ vs. in open water. Differences within the MIZ are significantly larger for both SST and SSS than in open water at all scales. Within-MIZ and nearby open water differences are larger than those measured during the transit at all scales. For context, we compared results from the salinity-dominated Arctic with a mainly temperature-dominated mid-latitude dataset collected off the coast of California at almost the same time.
Abstract The Last Ice Area (LIA), located north of the Canadian Arctic Archipelago and Greenland, has the Arctic's oldest and thickest sea ice. The LIA is hypothesized to be a potential climate refuge for ice‐dependent top predators as Arctic sea ice continues to decline. However, recent studies indicate the region may be less resilient than expected. We used a coupled biophysical model to examine the impact of changes in sea ice and nutrient availability on the LIA marine planktonic ecosystem and the ecological potential of this critical area. The model was used to generate two downscaled simulations which were forced by two Intergovernmental Panel on Climate Change AR6 climate models (GFDL‐ESM4 and CNRM‐CM6‐1‐HR using the SSP5‐8.5 shared socioeconomic pathway) to investigate potential changes in primary productivity (PP) with different rates of future warming. Both downscaled model runs, which captured observed sea ice dynamics, predicted declines in LIA sea ice concentration and thickness. Under CNRM‐CM6‐1‐HR, summer sea ice was largely absent from the LIA by 2055–2070, shortly after it disappeared elsewhere in the Arctic. Under GFDL‐ESM4, some summer sea ice persisted through 2070 although concentration and thickness were low. Concurrently with declining sea ice, both models predicted increases in PP through 2070, with annual values peaking in August. While increased PP would support higher trophic levels, ice‐dependent top predators require an ice platform for foraging and resting. Our approach of integrating physical and biological forecasts is a step towards a more complete picture to date of anticipated ecological changes in the LIA. We identify future research needs, which include evaluating additional climate models and forcing scenarios, collecting in situ ecological data, and obtaining a mechanistic understanding of how lower level ecological changes will affect top predators.
The Arctic surface mixed layer is an important moderator of the transfer of heat, salt, and momentum between the atmosphere and the warmer, more saline water that enter the Arctic Ocean from the North Pacific and North Atlantic oceans. However, prior observational studies of trends in mixed layer depth produce seemingly conflicting results due to limited temporal and spatial coverage. Using reanalyses which are consistent with the climatological mixed layer seasonal cycle, changes in the pan-Arctic mixed layer depth are assessed from 1980 to 2024. From the 1980s to the most recent decade, there was a shoaling of the winter (Oct-Mar) mixed layer and a slight deepening of the summer (Apr-Sep) mixed layer. Furthermore, time series of winter mixed layer depth anomalies show for the first time that the seemingly conflicting trends of prior studies can be reconciled as a result of significant decadal variability, particularly in the Canadian and Amerasian Basins. The decadal variability is found to be consistent with changes in the thickness of sea ice centered over the Canadian and Amerasian Basins. This work underscores how decadal variability in the sparsely observed Arctic can complicate the interpretation of long-term trends.
Weather and climate extremes are increasingly occurring in the Arctic. In this Review, we evaluate historical and projected changes in rare Arctic extremes across the atmosphere, cryosphere and ocean and elucidate their driving mechanisms. Clear shifts occur in mean and extreme distributions after ~2000. For instance, pre-2000 to post-2000 observational probabilities of 1.5 standard deviation events increase by 20% for atmospheric heat waves, 76.7% for Atlantic layer warm events, 83.5% for Arctic sea ice loss and 62.9% for Greenland Ice Sheet melt extent — in many cases, low probability, rare extreme events in the early period become the norm in the latter period. These observed changes can be explained using a ‘pushing and triggering’ concept, representing interplay between external forcing and internal variability: long-term warming destabilizes the climate system and ‘pushes’ it to a new state, allowing subsequent variability associated with large-scale atmosphere–ocean–ice interactions and synoptic systems to ‘trigger’ extreme events over different timescales. Ongoing anthropogenic warming is expected to further increase the frequency and magnitude of extremes, such that simulated probabilities of 1.5 standard deviation events increase by 72.6% for atmospheric heat waves, 68.7% for Atlantic layer warm events and 93.3% for Greenland Ice Sheet melt rate between historic (1984–2014) and future (2069–2099) periods under a very high emission scenario. Future research should prioritize the development of physically based metrics, enhance high-resolution observation and modelling capabilities and improve understanding of multiscale Arctic climate drivers. Rare and extreme climate events have increasingly occurred in the Arctic since ~2000. This Review outlines the observed and projected changes in atmospheric, oceanic and cryospheric extremes and explains their increasing occurrence through a ‘pushing and triggering’ framework.
An approach to scalable surface-drifting buoys is needed to enable the high spatial and temporal resolution of oceanographic data that the science and meteorological communities are asking for. With the number of active buoys predicted to increase by a factor of 100 or more, the impact on the environment becomes even more important. Here, we present a pathway to a scalable and sustainable generation of buoys. We identify the main criteria to be used when developing such buoys to be low cost, with reliable data and neutral or even positive environmental impact. For each buoy subsystem—hull, electronics, energy generation and storage, sensors, and communication system—cutting-edge technological solutions are presented, many of them from emerging research in marine or other disciplines. We then assess the potential solutions against the design criteria and plot a path toward small, environmentally friendly, low-cost, and low-power buoys.
The Arctic Ocean has seen a profound sea ice loss during the summer, with changes most pronounced in the Western Arctic. This has resulted in the Chukchi Sea, located just north of Bering Strait, being ice-free by the end of summer since the late 1990s, except during 2024. Here, we investigate the processes responsible for the return of summer sea ice to the region during 2024. We show that an exceptional ice convergence event in February 2024, along with additional events in the winter and spring, resulted in ice thicknesses along the Siberian coast of the Chukchi Sea through the summer months that exceeded values seen in the region during the late 20th century. We argue that a thinner and more mobile ice pack contributed to this remarkable return of summer sea ice after a 25-year hiatus, opening the possibility of similar events in the future.
There are many challenges associated with obtaining high-fidelity sea ice concentration (SIC) information, and products that rely solely on passive microwave measurements often struggle to represent conditions at low concentration, especially within the marginal ice zone and during periods of active melt. Here, we present a newly gridded SIC product for the Alaskan Arctic, generated with data from the National Weather Service Alaska Sea Ice Program (hereafter referred to as ASIP), that synthesizes a variety of satellite SIC and in situ observations from 2007–present. These SIC fields have been primarily used for operational purposes and have not yet been gridded or independently validated. In this study, we first grid the ASIP product into 0.05° resolution in both latitude and longitude (hereafter referred to as gridded ASIP, or grASIP). We then perform extensive intercomparison with an international database of ship-based in situ SIC observations, supplemented with observations from saildrones. Additionally, an intercomparison between three ice products is performed: (i) grASIP, (ii) a high-resolution passive microwave product (AMSR2), and (iii) a product available from the National Snow and Ice Data Center (MASIE) that originates from the US National Ice Center (USNIC) operational IMS product. This intercomparison demonstrates that all products perform similarly when compared to in situ observations generally, but grASIP outperforms the other products during periods of active melt and in low-SIC regions. Furthermore, we show that the similarity in performance among products is partly due to the deficiencies in the in situ observations' geographical distribution, as most in situ observations are far from the ice edge in locations where all products agree. We find that the grASIP ice edge is generally farther south than both the AMSR2 and MASIE ice edges by an average of approximately 50 km in winter and 175 km in summer for grASIP vs. AMSR2 and 10 km in winter and 40 km in summer for grASIP vs. MASIE.
Sea surface salinity (SSS) anomalies and near-surface thermohaline stratification are key parameters to improve our understanding of sea ice retreat and formation in polar regions. Since 2010, the remote sensing salinity missions SSS observations globally (SSSSMOS and SSSSMAP, respectively). In this study, we compare these observations with in situ salinity observations (SSSin-situ) made during the NASA salinity field campaign Salinity and Stratification at Sea Ice Edge (SASSIE) during the fall of 2022. The SASSIE SSSin-situ were collected by nine different platforms: Castaway Wave Instrument Float with Tracking (SWIFT) drifters, Upper Temperature of the Polar Oceans (UpTempO) buoys, Launched Autonomous Micro Observer (ALAMO) profilers. Because satellite SSS retrievals are impacted by land and sea ice contaminations, cold temperatures, and surface roughness, mean differences, root-mean-square difference (RMSD), and standard deviation (STD) between satellite SSS and SSSin-situ are examined as a function of distance from the coast and sea ice edge, sea surface temperature (SST), and wind speed. We find that SSSSMOS and SSSSMAP are well correlated (0.66 and 0.78, respectively) with similar RMSD when compared with SSSin-situ. Close to the coast (0-150 km), SSSSMAP compares better with SSSin-situ with RMSD (,2 g kg21) lower than that from SSSSMOS. Near the sea ice edge (0-150 km), SSSSMOS compares better with SSSin-situ with RMSD (,2.5 g kg21) lower than that from SSSSMAP. In cold water (SST , 1.5 degrees C) and low wind speed conditions (,7 m s21), both SSSSMOS and SSSSMAP are consistent with each other. The RMSD between SSSSMAP and SSSin-situ decreases considerably (,1 g kg21) when SST . 1.5 degrees C, while the RMSD between SSSSMOS and SSSin-situ shows less dependence on SST.
The stability of the upper ocean is crucial for the exchange of momentum, heat, and salt between sea ice and subsurface warm water in the Arctic Ocean's Beaufort Gyre (BG) region. Here, based on multiple in situ observations, the shifting phases of the BG during 2003-23 are objectively defined. We find that the potential energy anomaly (PEA) in the upper 55 m decreased from 130.9 +/- 2.3 J m23 during 2006-12 with BG intensification to 90.3 +/- 2.0 J m23 during 2013-19 with BG relaxation. Further, the mixed layer became saltier and deeper across all seasons. Decreasing PEA indicates an overall weaker stratification in the upper water column which promotes stronger vertical entrainment. We also find that the mixed layer heat content increased across nearly all seasons, except during July-September (summer). Our analysis using a Price-Weller-Pinkel model suggests that the cause of this warming was not atmospheric heat fluxes from above, but rather subsurface heat entrainment upward. The key mechanism is that the seasonal amplitude of PEA is smaller during 2013-19 when the BG relaxes, thereby allowing mixing to greater depths under the same surface salt flux as in 2006-12. This is important for the future evolution of the sea ice melting and oceanic vertical mixing if the BG relaxes further. SIGNIFICANCE STATEMENT: Our study demonstrates that the relaxation of the Beaufort Gyre during 2013-19 resulted in a saltier and deeper mixed layer across all seasons, accompanied by a reduction in potential energy anomaly (i.e., weakening stratification) and also its seasonal variation in the upper 55 m. This enhances subsurface heat entrainment from both the near-surface temperature maximum and the Pacific Summer Water layers during fall and winter, which will likely impact future sea ice melting.
The Arctic sea ice cover has decreased rapidly over the last few decades both in extent and thickness. Here we present multi‐year (2013–2022) observations of sea ice thickness in the northwestern Barents Sea based on Upward Looking Sonar measurements and show that the winter sea ice has become thicker over the last decade. Sea ice thickness from the Pan‐Arctic Ice Ocean Modeling and Assimilation System (PIOMAS) reproduces both the observed variability and recent 10‐year trend and shows that this thickening (0.24 m decade−1) has not been seen since the 1990s. Using PIOMAS we find that the recent increase in sea ice thickness can be explained by increased sea ice freezing as a result of lower temperatures in the ocean and in the atmosphere. The recent thickening is set in the context of a long‐term thinning trend, with PIOMAS showing much thinner ice now than in the 1980s.
The Arctic is one of the most important regions in the world’s oceans for understanding the impacts of a changing climate. Yet, it is also difficult to measure because of extreme weather and ice conditions. In this work, we directly compare four datasets from the Group for High-Resolution Sea Surface Temperature (GHRSST) with a NASA Saildrone deployment along the Alaskan Coast and the Bering Sea and Bering Strait. The four datasets used are the Remote Sensing Systems Microwave Infrared Optimally Interpolated (MWIR) product, the Canadian Meteorological Center (CMC) product, the Daily Optimally Interpolated Product (DOISST), and the Operational Sea Surface Temperature and Ice Analysis (OSTIA) product. Spatial sea surface temperature (SST) gradients were derived for both the Saildrone deployment and GHRSST products, with the GHRSST products collocated with the Saildrone deployment. Overall, statistics indicate that the OSTIA product had a correlation of 0.79 and a root mean square difference of 0.11 °C/km when compared with Saildrone. CMC had the highest correlation of 0.81. Scatter plots indicate that OSTIA had the slope closest to one, thus best reproducing the magnitudes of the Saildrone gradients. Differences increased at latitudes > 65°N where sea ice would have a greater impact. A trend analysis was then performed on the gradient fields. Overall, positive trends in gradients occurred in areas along the coastal regions. A negative trend occurred at approximately 60°N. A major finding of this study is that future work needs to revolve around the impact of changing ice conditions on SST gradients. Another major finding is that a northward shift in the southern ice edge occurred after 2010 with a maxima at approximately 2019. This indicates that the shift of the southern ice edge is not gradual but has dramatically increased over the last decade. Future work needs to revolve around examining the possible causes for this northward shift.
As our planet warms, Arctic sea ice coverage continues to decline, resulting in complex feedbacks with the climate system. The core objective of NASA's Salinity and Stratification at the Sea Ice Edge (SASSIE) mission is to understand how ocean salinity and near-surface stratification affect upper-ocean heat content and thus sea ice freeze and melt. SASSIE specifically focuses on the formation of Arctic Sea ice in autumn. The SASSIE field campaign in 2022 collected detailed observations of upper-ocean properties and meteorology near the sea ice edge in the Beaufort Sea using ship-based and piloted and drifting assets. The observations collected during SASSIE include vertical profiles of stratification up to the sea surface, air-sea fluxes, and ancillary measurements that are being used to better understand the role of salinity in coupled Arctic air-sea-ice processes. This publication provides a detailed overview of the activities during the 2022 SASSIE campaign and presents the publicly available datasets generated by this mission (available at https://podaac.jpl.nasa.gov/SASSIE, last access: 29 May 2024; DOIs for individual datasets in the "Data availability" section), introducing an accompanying repository that highlights the numerical routines used to generate the figures shown in this work.
The Arctic region has warmed nearly four times faster than the global average since 1979, with far-reaching global implications. However, model projections of Arctic warming rates are uncertain and one key component is the ocean heat transport (OHT) into the Arctic Ocean. Here we use high-resolution historical and future climate simulations to show that the OHT through the Bering Strait exerts a more substantial influence on Arctic warming than previously recognized. The high-resolution ensemble exhibits a 20% larger warming rate for 2006–2100 compared with standard low-resolution model simulations. The enhanced Arctic warming in the high-resolution simulations is primarily attributable to an increased OHT through the narrow and shallow Bering Strait that is nearly four times larger than in the low-resolution simulations. Consequently, the projected rate of Arctic warming by low-resolution climate simulations is likely to be underestimated due to the model resolution being insufficient to capture future changes in Bering Strait OHT. Projections of Arctic warming have large uncertainties. Here the authors consider ocean heat transport and its contribution to Arctic warming; high-resolution model results show increased Bering Strait transport compared with lower-resolution results, with implications for projected warming rates.
This study quantifies the state of the art in the rapidly growing field of seasonal Arctic sea ice prediction. A novel multimodel dataset of retrospective seasonal predictions of September Arctic sea ice is created and analyzed, consisting of community contributions from 17 statistical models and 17 dynamical models. Prediction skill is compared over the period 2001-20 for predictions of pan-Arctic sea ice extent (SIE), regional SIE, and local sea ice concentration (SIC) initialized on 1 June, 1 July, 1 August, and 1 September. This diverse set of statistical and dynamical models can individually predict linearly detrended pan-Arctic SIE anomalies with skill, and a multimodel median prediction has correlation coefficients of 0.79, 0.86, 0.92, and 0.99 at these respective initialization times. Regional SIE predictions have similar skill to pan-Arctic predictions in the Alaskan and Siberian regions, whereas regional skill is lower in the Canadian, Atlantic, and central Arctic sectors. The skill of dynamical and statistical models is generally comparable for pan-Arctic SIE, whereas dynamical models outperform their statistical counterparts for regional and local predictions. The prediction systems are found to provide the most value added relative to basic reference forecasts in the extreme SIE years of 1996, 2007, and 2012. SIE prediction errors do not show clear trends over time, suggesting that there has been minimal change in inherent sea ice predictability over the satellite era. Overall, this study demonstrates that there are bright prospects for skillful operational predictions of September sea ice at least 3 months in advance.
Inaugural Workshop and Early Career School of the Consortium for the Advancement of Marine Arctic Science (CAMAS) What: : Participants met to discuss key marine Arctic processes that contribute to the rapid changes in the Arctic and to develop collaborative activities to address knowledge gaps. When: : 13-16 February 2024 Where: : Santa Fe, New Mexico, and remote
 Jinlun Zhang合作论文数Polar Science Center, Applied Physics Laboratory, University of Washington51
 James H. Morison合作论文数Polar Science Center;Applied Physics Laboratory;Polar Science Center|Applied Physics Laboratory34
 Axel Schweiger合作论文数Polar Science Center, University of Washington31
 Andrey Proshutinsky合作论文数18
 Wieslaw Maslowski合作论文数13
 Richard Krishfield合作论文数Department of Physical Oceanography, Woods Hole Oceanographic Institution13Wendy Ermold合作论文数13
 James E. Overland合作论文数Pacific Marine Environmental Laboratory|NATIONAL OCEANIC AND ATMOSPHERIC ADMINISTRATION13
 Uma S Bhatt合作论文数U. Illinois Champaign-Urbana13
 Mary-Louise Timmermans合作论文数Department of Earth & Planetary, Yale University11Miles G. Mcphee合作论文数McPhee Research Company;Applied Physics Laboratory, University of Washington11
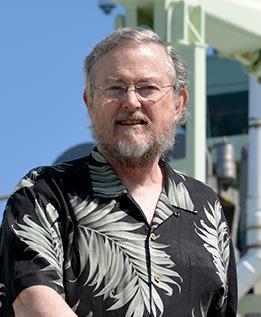 John M. Toole (John Toole)合作论文数Department Physical Oceanography, Woods Hole Oceanographic Institution10Harry Stern合作论文数Applied Physics Laboratory, University of Washington10Sirpa Hakkinen合作论文数Goddard Space Flight Center, National Aeronautics and Space Administration9
 Josefino Comiso合作论文数Cryospheric Sciences Laboratory, Goddard Space Flight Center, National Aeronautics and Space Administration9D Andrew Rothrock合作论文数9
 Wilbert Weijer合作论文数Institute for Marine and Atmospheric Research Utrecht, Utrecht University9
 Michael Karcher合作论文数Climate Sciences/Sea ice Physics, Ocean Atmosphere Systems/Alfred Wegener Institute8Jian Zhang合作论文数University of Washington8
 Knut Aagaard合作论文数Applied Physics Laboratory, Polar Science Center, University of Washington;School of Oceanography, College of the Environment, University of Washington8
 William M. Smethie合作论文数Lamont-Doherty Earth Observatory, Columbia University8
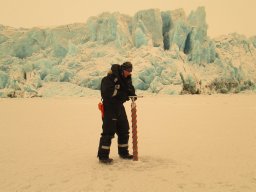 Matthew B. Alkire合作论文数Isotope Geosciences Laboratory, NERC8
 Craig Lee合作论文数Ocean Physics Department, Applied Physics Laboratory, University of Washington8
 Peter Schlosser合作论文数Global Institute of Sustainability and Innovation, Arizona State University8
 Patricia A. Matrai合作论文数Rosenstiel School of Marine and Atmospheric Sciences, University of Miami8
 Don Perovich合作论文数Thayer School of Engineering, Dartmouth College7
 D. A. Walker合作论文数Department of Biology and Wildlife, Faculty of Biology and Wildlife, University of Alaska Fairbanks7
 John E. Walsh合作论文数Department of Climate, Meteorology & Atmospheric Sciences, School of Earth, Society & Environment, University of Illinois Urbana-Champaign;International Arctic Research Center, University of Alaska Fairbanks7Takashi Kikuchi合作论文数7
 Howard E. Epstein合作论文数Department of Environmental Sciences, College and Graduate School of Arts & Sciences, University of Virginia7
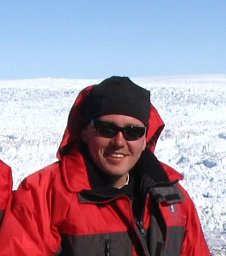 David M. Holland合作论文数Courant Institute of Mathematical Sciences, New York University7Frank Kauker合作论文数Alfred Wegener Institute7Ursula Schauer合作论文数7
 Igor V. Polyakov合作论文数International Arctic Research Center, University of Alaska Fairbanks7Richard B. Lammers合作论文数Water Systems Analysis Group, University of New Hampshire7Jorge E. Pinzon合作论文数7Ron Lindsay合作论文数Applied Physics Laboratory, University of Washington Seattle7
 Kent Moore合作论文数Department of Chemical & Physical Sciences, University of Toronto Mississauga6
 Jason Box合作论文数Department of Glaciology and Climate, Geologic Survey of Denmark and Greenland6Greg Holloway合作论文数6
 Thomas M Smith合作论文数National Oceanic and Atmospheric Administration6
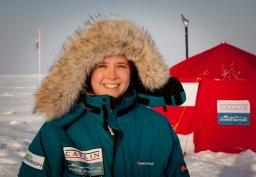 Victoria Hill合作论文数Department of Ocean, Earth and Atmospheric Sciences, Old Dominion University6
 Suzanne Dickinson合作论文数6
 Rudiger Gerdes合作论文数Alfred-Wegener-Institut Helmholtz-Zentrum für Polar- und Meeresforschung, Bremerhaven, Germany6
 Walter Meier合作论文数National Snow and Ice Data Center, University of Colorado Boulder6
 Vladimir E. Romanovsky合作论文数Permafrost Laboratory, Geophysical Institute, University of Alaska Fairbanks6Robert G. Campbell合作论文数6Carin J. Ashjian合作论文数Biology Department, Woods Hole Oceanographic Institution6




