Depression is a mental disorder that can lead to self-harm or suicidal thoughts if left untreated. Clinicians face the challenge of determining the most effective therapeutic approach to depression. Selective Serotonin Reuptake Inhibitors are widely prescribed depression therapies, but their response rate is only around 50 %, which is relatively low compared to the treatment success of other mental diseases. To address this issue, a novel classification framework is introduced to build a computer-aided decision system that predicts the outcome of depression therapies. This proposed system utilizes novel systematic extraction and selection of time-domain features. Our methodology is not only effective for EEG subject classification but also widely applicable to similar EEG studies benefitting researchers working in cognitive, affective, and clinical neuroscience. In this 30 -subject pilot study, the multi-channel EEG signals are denoised using low and high-pass filters. Subsequently, feature extraction models are applied to the channels to extract the generalized pattern of the EEG data. Overlap coverage for moving segments was varied from $\mathbf{0} \boldsymbol{\%}$ to $\mathbf{7 5 \%}$, and four feature selection algorithms were evaluated. To avoid bias in the results, the classification models are trained and validated using a leave-one-subject-out (LOSO) crossvalidation strategy. To prevent data leakage during feature selection, the test subject in each fold was excluded from the dataset prior to feature ranking. Randomized experiments repeated 30 times indicate that models utilizing under 50 features consistently reach an average balanced accuracy of 95%. In conclusion, this novel approach demonstrates its effectiveness through highly accurate and nonbiased classification results. The top-ranking features, dominated by energy and variability metrics from right frontal (F8), central (Cz), and occipital (O2) channels, highlight the critical role of fronto-central and posterior cortical dynamics in characterizing depression-related EEG biomarkers.
Abstract: Patients with acquired aplastic anemia (AA) treated with immunosuppressive therapy (IST) face up to a 20% long-term risk of developing secondary myeloid neoplasms (sMNs), including acute myeloid leukemia and myelodysplastic syndromes. Although hematopoietic stem cell transplantation (HSCT) is curative and prevents sMNs, older patients and those lacking suitable donors have historically received IST as first-line therapy. Recent improvements in HSCT outcomes have expanded transplant eligibility, highlighting the need for tools to better identify patients at high risk for sMN. Validated predictive models could help guide early HSCT consideration or tailor surveillance strategies. We developed 2 binary machine learning models to predict sMN development in patients with acquired AA at clinically relevant time points: diagnosis (model 1) and 6 months after IST response (model 2). We analyzed data from 275 adult patients with AA treated at University of Texas Southwestern, Cleveland Clinic, and the Hospital of the University of Pennsylvania between 1975 and 2023. Seventy-nine clinical variables were collected, including demographics, somatic mutations, and treatment response. Neural networks were trained with leave-1-out crossvalidation. Both models achieved strong performance (area under the curve, 0.82; sensitivity, 0.82, specificity, 0.73). Shared key predictors included DNMT3A mutation, CUX1 mutation, total mutation count, and age. TET2 mutation was specific to model 1; paroxysmal nocturnal hemoglobinuria clone presence was unique to model 2. High-risk classification was significantly associated with worse overall survival (P < .0001). These findings support the feasibility of machine learning–based sMN risk prediction in AA. With training on larger data sets and external validation, these models may support individualized decision-making around HSCT and post-IST surveillance.
Background and Objective Detection of extraprostatic extension (EPE) preoperatively is of critical importance in the context of prostate cancer (PCa) management and outcomes. This study aimed to characterize the radiomic features of malignant prostate lesions based on multi-paramagnetic magnetic resonance imaging (mpMRI). Methods We analyzed 20 patients who underwent mpMRI followed by radical prostatectomy. Two experienced radiologists manually segmented the 3D lesions using the T2-weighted (T2WI) and Apparent Diffusion Coefficient (ADC) imaging sequences. A total of 210 radiomic features were extracted from each lesion. We used the Recursive Feature Elimination with Cross-Validation to select key features. Using the selected radiomic features, we developed a Multilayer Perceptron (MLP) neural network to classify the EPE and non-EPE lesions. The pathology results were accepted as gold standard for EPE. We measured the performance of the classifier, calculating the area-under-curve (AUC), sensitivity, and specificity. Results A total of 25 lesions were segmented, including 12 lesions with EPE and 13 lesions without EPE, based on the pathology reports. We selected 18 radiomic features (18/210). The MLP classifier using these features provided a good sensitivity (0.75), specificity (0.79), and AUC of 0.82, 95% CL [0.59 - 0.96] in identifying the EPE lesions. Conclusions This pilot study presents 18 radiomic features derived from T2-weighted and ADC images and demonstrates their potential in the preoperative prediction of EPE in PCa using an MLP model.
Signal resolution is crucial for diverse applications, notably impacting accuracy, signal-to-noise ratio, and system performance. Today, microcontrollers (MCUs) designed for industrial purposes provide analog-to-digital converter (ADC) resolutions ranging from 10 to 16 bits. Therefore, evaluating the ADC resolution of machine learning algorithms is crucial to enhance the system's performance and cost-effectiveness. This study explores the impact of signal resolutions of 10, 11, 12, and 16-bit sensor data, emphasizing their significance in machine learning classification tasks specifically aimed at motor fault detection. By conducting controlled experiments, this study utilizes a comprehensive sensor dataset obtained from two industrial motors to assess the effects on signal quality and information retrieval. Since AC drives account for over 50% of global electricity consumption and find widespread use in various industrial applications, the findings shed light on the trade-offs associated with different resolution levels in real-world applications, particularly industrial settings. The research contributes to signal processing understanding, aiding the selection of resolutions for specific contexts, and facilitating informed decisions in motor-driven systems and machine learning classification.
Introduction: Paroxysmal nocturnal hemoglobinuria (PNH) is a rare disorder resulting from PIG-A gene mutations, causing loss of expression of CD55 and CD59 and leading to complement-mediated destruction of erythrocytes. With 10% of idiopathic aplastic anemia (AA) patients developing PNH, AA seemingly provides a suitable environment for unregulated, clonal expansion of the PNH clone. However, clonal expansion dynamics are diverse, ranging from primary PNH without anamnestic phase of AA, to smoldering clonal persistence, to various trajectories of clonal expansion. PNH diagnosis with flow cytometry (FC) cannot predict the risk or degree of clonal expansion. This study aims to develop a machine learning (ML) algorithm that can predict risk of clonal expansion using laboratory values measured at initial presentation. Methods: The medical records of all AA patients with an initial PNH clone < 20% (n=104) at the participating institutions were examined. Variables collected at time of initial PNH diagnosis were sex (51 male and 53 female), age at diagnosis (median age of 45.6 years), LDH, Hgb, WBC, ANC, severity of AA, PLT, MCV, Haptoglobin, reticulocyte %, PNH granulocyte clone size, PNH monocyte clone size, Type II/III RBC size, thrombosis history, d-dimer, t-bilirubin, and AST/ALT. Secondary variables collected were type and duration of therapy received (eculizumab [n=10], ravulizumab [n=11], pegcetacoplan [n=5]) and exposure to hATG, cyclosporine, or eltrombopag. FC data up to 15 years after initial measurement was assessed and patients were assigned to the expander group (n=21) if their PNH clone increased to greater than 20%, or to the non-expander group (n=83) if they remained <20%. Missing data (15% of the dataset) was imputed with the MICE algorithm in SciKit Learn. A Multilayer Perceptron algorithm with 4 hidden layers (24, 12, 6, 2 neurons per layer) was used for classification experiments. The leaky rectified linear unit (ReLU) activation function was employed with an alpha value of 0.1. The positive class (expander) was given a higher weight of 3.4 due to the imbalanced class distribution (21 vs. 83) in the dataset. Random Forest feature importance was iteratively calculated (N=10) to rank 23 features. We used Leave-One-Out (LOO) cross-validation to validate our model, where a single subject from the dataset is used as the validation set while the remaining cohort (N-1 = 103) forms the training set. This was repeated until every subject in the dataset had been used as the validation set exactly once. To determine the optimum set of features, we iteratively reduced the number of features in the classification model. Results: The best preliminary model was achieved with 5 variables (initial PNH granulocyte, monocyte, Type II RBC, and Type III RBC clone sizes, as well as haptoglobin), obtaining a sensitivity of 0.81, a specificity of 0.83, and an ROC-AUC of 0.82. Initial clone size (median and [min, max]) for the cohort was- granulocytes: 1% [0.01%, 18%], monocytes: 1.5% [0%, 20%], and total RBC clones: 0.21% [0%, 7.7%]. At the last follow-up, the cohort's clone size was- granulocytes: 1.37% [0%, 99.87%], monocytes: 2.5% [0.16%, 91%], and total RBC clones: 0.7% [0%, 96.34%]. For the expander group, initial clone size was- granulocytes: 6.31% [0.17%, 18%], monocytes: 17% [4%, 20%], and total RBC clones: 0.48% [0.03%, 2.82%]. The non-expander group initial clone size was- granulocytes: 0.595% [0.01%, 15%], monocytes: 0.74% [0%, 14%], and total RBC clones: 0.16% [0%, 4%]. The median time from diagnosis to the last follow-up was 8.23 years (expander) and 3.58 years (non-expander). Conclusion: The preliminary model shows promise in distinguishing between high and low-risk groups using variables consistent with existing literature. The final ML model will draw from a larger cohort size to improve predictive power, offering a valuable tool for early intervention and monitoring to prevent thromboembolic events in high expansion-risk patients.
Implementing machine learning algorithms on industry-specific embedded platforms poses challenges due to restricted resources like bandwidth, memory, and resolution, among others. Therefore, it is essential to optimize the employed features, tree depth, learning rate, code, etc. This study aims to detect distributed bearing faults in AC drives by utilizing the optimal feature selection in fault diagnosis. This approach is innovative in its comprehensive integration of six distinct types of signals: three vibration signals, stray magnetic flux signals, and two phase-current signals. Using a data acquisition board and a dynamometer setup, 16-bit sensor data is gathered from two induction motors. This encompasses 50 operational points, spanning 10 distinct speed levels and 5 torque levels. A total of 42 time-domain features (TDFs), frequently employed in industrial applications, are chosen, and their significance is assessed within a machine learning (ML) framework. To ensure the reliability of the feature selection process and the fault-detection algorithm, comprehensive tests are conducted for validation purposes. A 10-fold cross-validation with Random Forest (RF) classifiers compares various settings and time-domain features, revealing that the vibration sensor has the greatest impact on classification accuracy. The classification outcomes are compelling, showcasing remarkable potential in detecting distributed bearing faults with only 32 decision trees and 10 features. A key finding of this study is identifying the most effective set of time-domain features in the classification of distributed bearing faults.
Introduction When evaluating thrombocytopenia, it is crucial to accurately distinguish between megakaryocyte hypoplasia resulting from a bone marrow failure disorder such as in aplastic anemia (AA) and platelet destruction due to immune thrombocytopenia (ITP). This accurate differentiation is essential for making prompt treatment decisions and averting potential complications from thrombocytopenia and treatment complications, notably major bleeding and infections, respectively. Hee-Jin Kim et al. showed the utility of immature platelet fraction (IPF%) in differentiating between ITP and AA, albeit with limited sensitivity of 54.0% (Kim et al., 2010). IPF% can be influenced by platelet transfusions (Bat et al., 2013). Megakaryocyte production may also be suppressed among ITP patients, potentially complicating the distinction of ITP and AA, particularly in cases where thrombocytopenia is the predominant feature, likely related to antiplatelet autoantibodies (McMillan et al., 2004). This underscores the urgent requirement for a more refined biomarker in the clinical realm to aid with improving diagnostic accuracy. We hypothesize that absolute immature platelet number (AIPN) can be a more sensitive and specific test to differentiate AA and ITP. Methods Our study cohort encompassed a diverse array of participants with ITP (n=32) and those with AA (n=15) from 2015-2023 seen at the University of Texas Southwestern Medical Center. We retrospectively analyzed medical records of patients at our institution with diagnosis of AA and ITP to determine IPF% collected at the time of the diagnosis and before the onset of ITP treatment as well as while on treatment, respectively. The AIPN was calculated by multiplying the IPF by the circulating platelet count and dividing by 100. This study was approved by the Institutional Review Board (IRB) at University of Texas Southwestern with reference number STU-2021-1114. Results We compared AIPN values of 15 AA subjects (M = 0.74, SD = 0.755) to the 48 ITP subjects (M = 12.2, SD = 13.09), and found that the AA cohort consists of significantly lower AIPN values by t-test (t-value=3.4, p<0.05). Our analysis identified an optimal threshold at which AA was classified as AIPN<=2.1 x10⁹/L and ITP was classified as AIPN>2.1 x10⁹/L, with AUC of 0.91, accuracy of 94%, sensitivity of 93% (correct prediction of AA), and specificity of 94% (correct prediction of ITP). We additionally compared IPF% values of 15 AA subjects (M = 4.2, SD = 9.32) to the 48 ITP subjects (M = 20.2, SD = 230.13), and found that the AA cohort consists of significantly lower IPF% valuesby t-test (t-value=4.1, p<0.05). However, from various IPF% thresholds ranging from 2.1 to 12.6%, no IPF% threshold results in both sensitivity and specificity over 70%. Therefore, we infer that AIPN provides a more accurate indicator of AA versus ITP. Conclusions Markedly elevated thrombopoietin (TPO) levels are specifically linked to thrombocytopenia caused by megakaryocyte hypoplasia due to bone marrow failure, as opposed to situations characterized by platelet destruction (Bat et al., 2013; Emmons et al., 1996). However, it's essential to note that measuring TPO levels is not currently a standard practice, often not readily available in local labs, and is primarily reserved for research purposes. In clinical scenarios, AA patients may be incorrectly diagnosed and treated for ITP. This misclassification can lead to delays in administering the appropriate treatment for AA, worsening the overall prognosis (Nakao, 2016). While our cohort is small and the results need to be confirmed in a larger study, our findings underscore the importance of AIPN in guiding clinicians to reliably differentiate between AA and ITP with high accuracy. The simplicity, feasibility, and accessibility of AIPN testing make it a valuable and reliable biomarker for clinical use. It serves as a tool in facilitating prompt and accurate diagnoses, thereby enhancing the overall management of patients with aplastic anemia.
Introduction Paroxysmal Nocturnal Hemoglobinuria (PNH) is a life-threatening blood disorder characterized by the destruction of red blood cells due to complement system dysregulation. The advent of C5 complement inhibitors has markedly improved the outlook for PNH patients by mitigating intravascular hemolytic crises and thrombotic events. However, many patients undergoing C5-inhibitor treatment experience C3-mediated extravascular hemolysis (EVH), which can lead to transfusion dependence, lower quality of life, and poorer health outcomes. The development of proximal complement inhibitors has heightened the need to identify patients at high risk for EVH resulting from C5 inhibitor therapy. Predictive models that identify these high-risk PNH patients could enable personalized, physician-supervised treatment selection, improving clinical outcomes and reducing healthcare costs. We describe a machine learning model, trained on demographic, laboratory, and Next-Generation Sequencing (NGS) data, designed to predict the risk of EVH in PNH patients. Methods We analyzed the medical records of 172 PNH patients treated between 2000 and 2022 at the University of Texas Southwestern and Cleveland Clinic Foundation. The dataset included clinical, laboratory, and NGS sequencing information, with specific clinical variables such as the type and duration of complement inhibitor(s) used, PNH clone size and distribution, EVH occurrence, antecedent aplastic anemia, and laboratory markers of hemolysis. Laboratory markers included lactate dehydrogenase (LDH), hemoglobin, absolute reticulocyte count and percentage, total bilirubin, d-dimer, AST, ALT, direct antiglobulin test (DAT), WBC, MCV, and platelet count. Missing data were imputed using the K-Nearest Neighbors algorithm (K=10). Feature selection through a Random Forest algorithm identified 23 significant clinical markers. A 5-layer multilayer perceptron classification algorithm trained using Leave-One-Out Cross Validation (LOOCV), achieved 87% sensitivity, 75% specificity, and an Area Under the Curve (AUC) of 0.80. Results Out of the 172 patients, 104 started on C5 complement inhibitors, while one began on a C3 inhibitor; eventually, nine were on a C3 inhibitor. About 26% of patients (n=27) were tested for EVH based on persistent anemia, with 15 testing positive for C3 complement activation at DAT evaluation. Of these, 71% were treated with eculizumab, and 28% with ravulizumab. Significant differences in clinical markers, such as Type II RBC levels (predictive score of 0.72), hemoglobin levels (predictive score of 0.42), LDH levels (predictive score of 0.50), and reticulocyte counts (predictive score of 0.46), were observed between EVH-positive and EVH-negative patients. Discussion Our findings are promising, demonstrating a machine learning model capable of predicting EVH with high accuracy. Given the recent approval of C3 and factor B inhibitors and ongoing development of proximal complement inhibitors, predicting EVH in PNH patients on C5 inhibitor therapy is increasingly relevant. Our model represents a significant advancement in identifying the risk of EVH at the time of diagnosis using accessible clinical variables. This predictive capability could enhance treatment monitoring, personalize treatment strategies based on patient risk profiles, and reduce healthcare costs. Future retrospective cohort studies to validate our model on patient data from other institutions would be valuable.
PURPOSE:Magnetic Resonance Imaging (MRI) evaluation of recurrent prostate cancer (PCa) following proton beam therapy is challenging due to radiation-induced tissue changes. This study aimed to evaluate MRI-based radiomic features so as to identify the recurrent PCa after proton therapy.METHODS:We retrospectively studied 12 patients with biochemical recurrence (BCR) following proton therapy. Two experienced radiologists identified prostate lesions from multi-parametric MRI (mpMRI) images post-proton therapy and marked control regions of interest (ROIs) on the contralateral side of the prostate gland. A total of 210 radiomic features were extracted from lesions and control regions on the T2-weighted (T2WI) and Apparent Diffusion Coefficient (ADC) image series. Recursive Feature Elimination with Cross-Validation method (RFE-CV) was used for feature selection. A Multilayer Perceptron (MLP) neural network was developed to classify three classes: cancerous, benign, and healthy tissue. The 12-core biopsy results were used as the gold standard for the segmentations. The classifier performance was measured using specificity, sensitivity, the area under receiver operating characteristic curve (AUC), and other statistical indicators.RESULTS:Based on biopsy results, 10 lesions were identified as PCa recurrence while eight lesions were confirmed to be benign. Ten radiomic features (10/210) were selected to build the multi-class classifier. The radiomics classifier gave an accuracy of 0.83 in identifying cancerous, benign, and healthy tissue with a sensitivity of 0.80 and specificity of 0.85. The model yielded an AUC of 0.87, 95% CI [0.72-1.00] in differentiating cancer from the benign and healthy tissues.CONCLUSIONS:Our proof-of-concept study demonstrates the potential of using radiomic features as part of the differential diagnosis of PCa on mpMRI following proton therapy. The results need to be validated in a larger cohort.
Distributed bearing faults are highly common in industrial applications and display unpredictable vibration patterns impeding their detection. These faults stem from issues such as lubrication deficiencies, contamination, electrical erosion, roughness of the bearing surface, or the propagation of localized faults. This study aims to detect distributed bearing faults by utilizing a multisensory approach consisting of current, accelerometer, and fluxgate sensors. A novel 2-D deep learning framework is proposed, leveraging signals from six distinct sources, including three-axis vibration signals, stray magnetic flux signal, and two-phase current signals. Data are collected from 3- and 10-hp induction motors at 50 operational points, spanning ten speed levels and five torque levels. These six signals are transformed into matrices and combined to create a comprehensive matrix that provides an overall depiction of the bearing condition. The proposed deep learning architecture employs a 2-D convolutional model, which takes 2-D images as input and determines the bearing status. To evaluate the system's robustness, the data are divided into training and testing sets. The proposed model demonstrates remarkable effectiveness in detecting distributed bearing faults, achieving an impressive accuracy rate of 99.92%. Furthermore, a comprehensive comparison is provided, highlighting the impact of using various sets of inputs as sources for the deep learning model on the accuracy rate for each set. Through the analysis of the obtained results, a clear conclusion can be drawn: the model performs at its best when all six input sources are utilized.
Distributed bearing faults are the most common ones in industry and create random vibration patterns, which make their detection difficult. They are caused by lubrication issues, contamination issues, electrical erosion, bearing roughness, or the spread of a local fault. This research mainly focuses on the distrusted bearing faults diagnosis using a multi-sensory kit. For this purpose, a novel deep-learning framework is proposed to detect these faults using 3 axis vibrations and one stray magnetic flux signal. The data is collected at 50 operating points, i.e., 10 speed and 5 torque levels. The proposed architecture benefits from a multi-input pipeline consisting of time-frame signals and extracted features. A feature-rich architecture is proposed combining convolutional and high-level information. Although a deep learning structure coherently learns from the features through convolutional and LSTM layers, 20 predefined features sampled from each instance are also fed into the network to improve accuracy. The robustness of the overall system is validated with train/test split data. Deep learning results are compared with two more classification algorithms, SVM and XGBoost. The high accuracy of the proposed model demonstrates the superiority of the deep learning architecture for distributed bearing fault detection.
PurposePrediction of extraprostatic extension (EPE) is essential for accurate surgical planning in prostate cancer (PCa). Radiomics based on magnetic resonance imaging (MRI) has shown potential to predict EPE. We aimed to evaluate studies proposing MRI-based nomograms and radiomics for EPE prediction and assess the quality of current radiomics literature.MethodsWe used PubMed, EMBASE, and SCOPUS databases to find related articles using synonyms for MRI radiomics and nomograms to predict EPE. Two co-authors scored the quality of radiomics literature using the Radiomics Quality Score (RQS). Inter-rater agreement was measured using the intraclass correlation coefficient (ICC) from total RQS scores. We analyzed the characteristic s of the studies and used ANOVAs to associate the area under the curve (AUC) to sample size, clinical and imaging variables, and RQS scores.ResultsWe identified 33 studies-22 nomograms and 11 radiomics analyses. The mean AUC for nomogram articles was 0.783, and no significant associations were found between AUC and sample size, clinical variables, or number of imaging variables. For radiomics articles, there were significant associations between number of lesions and AUC (p < 0.013). The average RQS total score was 15.91/36 (44%). Through the radiomics operation, segmentation of region-of-interest, selection of features, and model building resulted in a broader range of results. The qualities the studies lacked most were phantom tests for scanner variabilities, temporal variability, external validation datasets, prospective designs, cost-effectiveness analysis, and open science.ConclusionUtilizing MRI-based radiomics to predict EPE in PCa patients demonstrates promising outcomes. However, quality improvement and standardization of radiomics workflow are needed.
Background: One of the major long-term complications in aplastic anemia (AA) is the clonal evolution to secondary myeloid neoplasms (sMNs) such as acute myeloid leukemia (AML) and myelodysplastic syndrome (MDS) 1. Hematopoietic stem cell transplantation (HSCT) is largely considered a curative treatment option for AA and is effective at preventing the clonal evolution of sMNs 2. However, patients over 40 years old or those with poor donor options are contraindicated for HSCT due to elevated post-transplant mortality rates 3. When treated with non-transplant strategies, patients with AA have indeed a high risk for acquisition/expansion of somatic myeloid mutations, with some harbingers of future clonal progression to full-blown MDS or AML. Older age, presence of myeloid mutations other than BCOR/L and PIGA at onset, and lack of response to standard immunosuppressive treatment (IST) have been identified as factors predictive for subsequent sMN evolution 4,5,6. If an individual patient's risk of developing a sMN could be assessed through a predictive model that uses information collected at initial AA diagnosis, providers may consider HSCT for traditionally contraindicated patients. However, no such predictive model that could aid in risk assessment currently exists. Methods: In our study, we utilized a large, multi-institutional cohort of patients diagnosed with AA to generate a comprehensive dataset. This dataset contained 76 variables, encompassing relevant clinical and molecular annotations. On this dataset, we trained a machine learning (ML) model to predict patients who would evolve sMNs. Variables with the highest feature impact score (FIS) in predicting clonal evolution to sMN were then chosen to be included in the final ML model, and the algorithm's fitness was calculated using the Leave-One-Out cross-validation method. Variables missing in more than 30% of subjects were imputed using K-Nearest Neighbors (N=20). Of our initial cohort of 455 patients, 213 patients were excluded from the study. 35 patients were excluded because they were treated with HSCT. 39 pediatric cases (defined as <18 years old at the time of diagnosis) were excluded from the study. 91 patients were removed for not receiving specific treatment (IST or HSCT). The remaining 77 patients were excluded due to having a sMN detected at the time of or prior to AA diagnosis, insufficient data, or detection of a germline mutation indicative of an inherited pathophysiology. Our final cohort included a total of 242 acquired AA patients from UT Southwestern Medical Center and Cleveland Clinic. Results: Among our final cohort of 242 patients, 119 (49.2%) were male. The cohort's mean and median ages at AA diagnosis were 53.1 years (SD = 18.9 years) and 58.1 years, respectively. The median follow-up time was 4.04 years. 80 (33.1%) of our patients had a clinically significant PNH clone (defined as >0.001%). 29 patients developed sMNs, with 24 developing MDS and 5 developing AML. Of patients who underwent clonal evolution to sMNs, the median age at the time of AA diagnosis and sMN diagnosis was 63.1 years and 67.2 years, respectively. The median time elapsed from initial AA diagnosis to sMN evolution was 3.78 years. The median time elapsed between initial AA diagnosis and earliest IST administration was 51 days. Chi-squared analysis showed that patients who received ATG treatment were more likely to develop sMNs, with 78.0% of all patients receiving ATG, while 96.6% of patients who developed sMNs had received ATG (p=0.00927). Our ML model achieved a sensitivity of 0.759, a specificity of 0.728, and an AUC of 0.78 using the ten variables with the highest feature impact score (FIS) to predict clonal evolution [Table 1]. All of the variables except for the presence of a PNH clone are positively correlated with sMN evolution. Nine of these variables are supported by existing literature 7,8. The feature with the third highest feature impact score, the time elapsed (days) between diagnosis and IST treatment, has not been established by previous studies and may be an important consideration in establishing optimal AA treatment guidelines. Conclusion: The strategic combination of this ML algorithm with clinical expertise has tremendous potential in improving health outcomes. Identification of patients at high risk for sMN and offering HSCT as a curative option upfront may lead to improved overall survival in AA patients.
Importance Early prognostication of patients hospitalized with COVID-19 who may require mechanical ventilation and have worse outcomes within 30 days of admission is useful for delivering appropriate clinical care and optimizing resource allocation. Objective To develop machine learning models to predict COVID-19 severity at the time of the hospital admission based on a single institution data. Design, setting, and participants We established a retrospective cohort of patients with COVID-19 from University of Texas Southwestern Medical Center from May 2020 to March 2022. Easily accessible objective markers including basic laboratory variables and initial respiratory status were assessed using Random Forest’s feature importance score to create a predictive risk score. Twenty-five significant variables were identified to be used in classification models. The best predictive models were selected with repeated tenfold cross-validation methods. Main outcomes and measures Among patients with COVID-19 admitted to the hospital, severity was defined by 30-day mortality (30DM) rates and need for mechanical ventilation. Results This was a large, single institution COVID-19 cohort including total of 1795 patients. The average age was 59.7 years old with diverse heterogeneity. 236 (13%) required mechanical ventilation and 156 patients (8.6%) died within 30 days of hospitalization. Predictive accuracy of each predictive model was validated with the 10-CV method. Random Forest classifier for 30DM model had 192 sub-trees, and obtained 0.72 sensitivity and 0.78 specificity, and 0.82 AUC. The model used to predict MV has 64 sub-trees and returned obtained 0.75 sensitivity and 0.75 specificity, and 0.81 AUC. Our scoring tool can be accessed at https://faculty.tamuc.edu/mmete/covid-risk.html . Conclusions and relevance In this study, we developed a risk score based on objective variables of COVID-19 patients within six hours of admission to the hospital, therefore helping predict a patient's risk of developing critical illness secondary to COVID-19.
IntroductionEnd-stage renal disease after heart transplant (HT) is associated with higher mortality and cost of care.1Cantarovich M. Hirsh A. Alam A. et al.The clinical impact of an early decline in kidney function in patients following heart transplantation.Am J Transplant. 2009; 9: 348-354https://doi.org/10.1111/j.1600-6143.2008.02490.xCrossref PubMed Scopus (27) Google Scholar,2Hornberger J. Best J. Geppert J. McClellan M. Risks and costs of end-stage renal disease after heart transplantation.Transplantation. 1998; 66: 1763-1770https://doi.org/10.1097/00007890-199812270-00034Crossref PubMed Scopus (43) Google Scholar Early and late renal failure after HT are caused by pretransplant comorbid factors (age, chronic kidney disease [CKD], diabetes mellitus, hypertension, and smoking), perioperative recurrent acute kidney injury (AKI), and use of nephrotoxic immunosuppressive agents (calcineurin inhibitors).3Lachance K. White M. Carrier M. et al.Long-term evolution, secular trends, and risk factors of renal dysfunction following cardiac transplantation.Transpl Int. 2014; 27: 824-837https://doi.org/10.1111/tri.12340Crossref PubMed Scopus (15) Google Scholar,4Habib P.J. Patel P.C. Hodge D. et al.Pre-orthotopic heart transplant estimated glomerular filtration rate predicts post-transplant mortality and renal outcomes: an analysis of the UNOS database.J Heart Lung Transplant. 2016; 35: 1471-1479https://doi.org/10.1016/j.healun.2016.05.028Abstract Full Text Full Text PDF PubMed Scopus (30) Google ScholarThe rate of simultaneous heart-kidney transplantation (SHKT) due to comorbid kidney disease has increased in the past decade.5Ariyamuthu V.K. Amin A.A. Drazner M.H. et al.Induction regimen and survival in simultaneous heart-kidney transplant recipients.J Heart Lung Transplant. 2018; 37: 587-595https://doi.org/10.1016/j.healun.2017.11.012Abstract Full Text Full Text PDF PubMed Scopus (7) Google Scholar The Organ Procurement and Transplant Network/the United Network for Organ Sharing, which oversees organ transplantation in the United States, has not set a national policy to guide SHKT. Thus, the decision for SHKT is currently left to individual transplant centers’ discretion. A consensus conference in 2019 on heart-kidney transplantation set the stage for developing guidelines for medical eligibility criteria for SHKT for candidates with established CKD (glomerular filtration rate [GFR] <60 ml/min per 1.73 m2) and persistent AKI.6Kobashigawa J. Dadhania D.M. Farr M. et al.Consensus conference on heart-kidney transplantation.Am J Transplant. 2021; 21: 2459-2467https://doi.org/10.1111/ajt.16512Crossref PubMed Scopus (12) Google Scholar Their Heart/Kidney Workgroup advised that, based on 2 independent GFR measurements at least 2 weeks apart, patients with established GFR <30 ml/min per 1.73 m2 and selected candidates with GFR of 30 to 44 ml/min per 1.73 m2 (having strong evidence of CKD including small kidney sizes and proteinuria >0.5 g/d) should be considered for SHKT. Remaining patients with CKD with GFR of 45–59 ml/min per 1.73 m2 may not be suitable for SHKT. Nevertheless, applying these criteria to HT alone recipients between 2000 and 2019, approximately 33% of them with an estimated GFR of 30–59 ml/min per 1.73 m2 pretransplant (Supplementary Table S1), not considered as eligible for SHKT, may still be at risk of developing end-stage renal disease. Therefore, a personalized computer-aided model to predict the possibility of advanced kidney failure in early post-transplant period is needed to identify at-risk candidates.In this study, we developed a machine learning (random forest [RF])–based algorithm to predict composite renal outcomes (CRO defined as dependence on chronic dialysis, GFR <20 ml/min per 1.73 m2, or having received a kidney transplant) among adult HT recipients at risk (GFR <60 ml/min per 1.73 m2) at post-transplant 1 year. We also built a web-based decision tool based on the RF model (Figure 1). The details regarding the study cohort selection (Supplementary Figure S1) and the methods are provided in the Supplementary Materials.ResultsCharacteristics of the Study CohortIn this retrospective study, we analyzed a cohort of adult recipients who received HT alone transplants (regardless of listing intention) between January 1, 2000, and September 30, 2019, using the Organ Procurement and Transplant Network national registry, which included 19,861 adult HT recipients with eGFR <60 ml/min per 1.73 m2 at listing and/or pretransplant.The incidence of the CRO at 1 year between 2000 and 2019 is found in Supplementary Figure S2 (ranging from 2.2% to 6.1%). The characteristics of the study cohort and corresponding deceased donors are found in Table 1 and Supplementary Table S2. The final study cohort included 19,861 patients, of which 783 (3.9%) had incident CRO. The 1-year survival among the patients who developed post-HT CRO (71.0%) was significantly lower compared with the ones who did not (88.3%) (log-rank P < 0.001).Table 1Characteristics and outcomes of the HT alone recipients (eGFR ≤60 ml/min per 1.73 m2 at listing and/or before transplant) between 2000 and 2019 by composite renal outcomes at 1 year in the United StatesRecipient characteristicsWhole cohortNo-CROCROP valueaP value applies to the comparison of no-CRO and CRO groups.n (%)19,86119,708 (96.1)783 (3.9)Age, median (IQR) yr59 (51–64)59 (51–64)59 (52–64)0.17Sex (male)14,761 (74.3)14,195 (74.4)566 (72.3)0.18Race<0.001 White14,395 (72.5)13,883 (72.8)512 (65.4) Black3415 (17.2)3215 (16.9)200 (25.5) Hispanic1302 (6.6)1257 (6.6)45 (5.8) Asian524 (2.6)505 (2.6)19 (2.4) Other225 (1.1)218 (1.1)7 (0.9)Recipient height (cm)173.9 ± 9.8173.9 ± 9.8173.4 ± 10.10.16Recipient weight (kg)83.4 ± 17.483.3 ± 17.485.2 ± 17.80.003Body mass index (kg/m2)27.5 ± 4.827.4 ± 4.828.2 ± 5.0<0.001History of diabetes<0.001 No13,932 (70.2)13,463 (70.6)469 (59.9) Type I382 (1.9)362 (1.9)20 (2.6) Type II5547 (27.9)5253 (27.5)294 (37.6)Etiology of cardiomyopathy0.34 Ischemic7815 (39.4)7510 (39.4)305 (39.0) Nonischemic7433 (37.4)7155 (37.5)278 (35.5) Congenital416(2.1)401 (2.1)15 (1.9) OtherbOther: restrictive cardiomyopathy, congenital, arrhythmia, valvular, and heart transplant-related diagnosis.4197 (21.1)4012 (21.0)185 (23.6)Previous HT, n (%)695 (3.5)663 (3.5)32 (4.1)0.36Cardiac output, l/min4.54 ± 1.464.54 ± 1.464.76 ± 1.53<0.001Cardiac index, l/min per m22.31 ± 0.702.30 ± 0.702.21 ± 0.67<0.001Pulmonary capillary wedge pressure, mm Hg18.8 ± 8.618.8 ± 8.618.5 ± 8.40.33Pulmonary artery mean pressure, mm Hg28.3 ± 9.928.3 ± 9.928.1 ± 9.30.58Mechanical ventilation requirement462 (2.3)437 (2.3)25 (3.2)0.10ECMO207 (1.0)190 (1.0)17 (2.2)0.002IABP1536 (7.7)1463 (7.7)73 (9.3)0.09VAD<0.001 None11,698 (58.9)11,306 (59.3)392 (50.1) LVAD alone6530 (32.9)6234 (32.7)296 (37.8) RVAD/BiVAD/TAH864 (4.4)797 (4.2)67 (8.6) Unknown769 (3.9)741 (3.9)28 (3.6)eGFR, ml/min per 1.73 m2 at listing (if not on dialysis)54.3 ± 17.654.5 ± 17.550.9 ± 18.7<0.001eGFR, ml/min per 1.73 m2 before transplant (if not on dialysis)53.3 ± 17.654.5 ± 17.645.8 ± 17.0<0.001eGFR ratio (before transplant/wait listing)1.10 ± 0.901.10 ± 0.910.99 ± 0.45<0.001Dialysis at listing, n (%)370 (1.9)339 (1.8)31 (4.0)<0.001Dialysis before transplant, n (%)1038 (5.2)907 (4.8)131 (16.7)<0.001Functional status by Karnofsky score before transplant, %<0.001 80–1003309 (16.7)3213 (16.8)96 (12.3) 51–796839 (34.4)6603 (34.6)316 (40.4) 0–508237 (41.5)7824 (41.0)396 (50.6) Unknown1476 (7.4)1438 (7.5)38 (4.9)UNOS region<0.001 1989 (4.5)865 (4.5)33 (4.2) 22371 (11.9)2229 (11.7)142 (18.1) 32233 (11.4)2177 (11.4)56 (7.2) 42340 (11.8)2252 (11.8)88 (11.2) 53136 (15.8)3017 (15.8)119 (15.2) 6656 (3.3)640 (3.4)16 (2.0) 71900 (9.6)1831 (9.6)69 (8.8) 81107 (5.6)1067 (5.6)40 (5.1) 91202 (6.1)1127 (5.9)75 (9.6) 101626 (8.2)1583 (8.3)43 (5.5) 112392 (12.0)2290 (12.0)102 (13.0)Waitlisted time (including inactive status), median (IQR), d87 (25–251)87 (25–250)104 (27–285)Post-transplant patient survival at 1 yr (based on Kaplan Meier estimates), %87.388.371.0<0.001Composite renal outcome incidence within 1 yr of heart transplantation, mean (the year 2000, the year 2019), %3.9 (2.6–6.1)Data are presented as n (%), median (IQR) as appropriate.BiVAD, biventricular assist device; CABG, coronary artery bypass graft; CRO, composite renal outcome; ECMO, extracorporeal membrane oxygenation; eGFR, estimated glomerular filtration rate; HT, heart transplant; IABP, intra-aortic balloon pump; IQR, interquartile range; LV, left ventricular; LVAD, left ventricular assist device; TAH, total artificial heart; UNOS, United Network of Organ Sharing; VAD, ventricular assist device.a P value applies to the comparison of no-CRO and CRO groups.b Other: restrictive cardiomyopathy, congenital, arrhythmia, valvular, and heart transplant-related diagnosis. Open table in a new tab Predictors of Post-HT CROsA total of 15 predictors of post-HT ROC were selected by the RBFOpt library and sorted by RF feature importance score (Supplementary Table S3) among 39 variables in the United Network for Organ Sharing-STAR Dataset (Supplementary Table S4).Performance of the RF ModelThe final RF model performed with a C-statistic of 0.70 (95% CI 0.67–0.74) (Supplementary Figure S3). At the fixed sensitivity of 80.0%, the model resulted in 46.2% specificity, 97.8% negative predictive value, and 8.1% positive predictive value. For the given negative predictive value performance, our RF model mislabeled 2.2% of cases (=100%–97.8%). On the basis of 2019 statistics, the absolute and relative reduction in risk prediction was 3.9% (=6.1%–2.2%) and 64% (=[6.1%–2.2% / 6.1%] × 100), respectively.Robustness of the ModelTo find the robustness of our model, we conducted 2 separate analyses. First, we trained the RF model using a data set that excluded patients who died in the no-CRO group; the model resulted in a C-statistic of 0.71 (95% CI 0.69–0.75). At the fixed sensitivity of 80.0%, the model had 46.3% specificity, 98.1% negative predictive value, and 8.0% positive predictive value. In the second analysis, we developed a RF survival model by treating the death event in the first year as a competing event to CRO occurrence and reported the accuracy of CRO prediction at 1 year. The competing event RF model classified CRO with 70.6% accuracy.Characteristics of the Patients Who DiedBecause post-transplant mortality is relevant to the analysis, we also described comparative characteristics of the patients who died in both groups within 1 year post-transplant (Supplementary Table S5). The post-HT patients with CRO who died were more likely to have diabetes and worse Karnofsky scores and require dialysis pretransplant than the patients in the no-CRO group who died.DiscussionOur decision tool with a web-based interface is practical as it uses readily existing recipient pretransplant variables and provides a personalized risk of developing CRO within 1 year of HT. The performance RF model did not significantly change with by censoring death in both robustness analyses.The variables selected in the RF model mostly align with previously described factors, including pretransplant renal function and need for renal replacement treatment, age, sex, race, diabetes mellitus, body mass index, functional status, ventricular assist device requirement, and pretransplant cardiac index.4Habib P.J. Patel P.C. Hodge D. et al.Pre-orthotopic heart transplant estimated glomerular filtration rate predicts post-transplant mortality and renal outcomes: an analysis of the UNOS database.J Heart Lung Transplant. 2016; 35: 1471-1479https://doi.org/10.1016/j.healun.2016.05.028Abstract Full Text Full Text PDF PubMed Scopus (30) Google Scholar,7Guven G. Brankovic M. Constantinescu A.A. et al.Preoperative right heart hemodynamics predict postoperative acute kidney injury after heart transplantation.Intensive Care Med. 2018; 44: 588-597https://doi.org/10.1007/s00134-018-5159-zCrossref PubMed Scopus (31) Google Scholar Deranged cardiac along with heightened risk of individuals with elevated right- and left-sided filling pressures and biventricular dysfunction may predispose these individuals to a greater risk of postoperative AKI.8Fortrie G. Manintveld O.C. Caliskan K. Bekkers J.A. Betjes M.G. Acute kidney injury as a complication of cardiac transplantation: incidence, risk factors, and impact on 1-year mortality and renal function.Transplantation. 2016; 100: 1740-1749https://doi.org/10.1097/TP.0000000000000956Crossref PubMed Scopus (40) Google Scholar If these individuals experience recurrent AKI post-transplantation, these episodes may result in lower GFR at 1 year post-HT and potentially transition into CKD, especially the ones complicated with stage 3 AKI according to the Kidney Disease Improving Global Outcomes guidelines.9Chawla L.S. Bellomo R. Bihorac A. et al.Acute kidney disease and renal recovery: consensus report of the Acute Disease Quality Initiative (ADQI) 16 Workgroup.Nat Rev Nephrol. 2017; 13: 241-257https://doi.org/10.1038/nrneph.2017.2Crossref PubMed Scopus (632) Google ScholarIn the setting of pre-HT, a negative prediction by our RF model, which has high negative predictive value, can serve as additional evidence that the patient has a lower risk of CRO post-HT and no need for SHKT. Clinical judgment (thorough physical examination and history taking, medication review, trending renal function on multiple data points, renal imaging, urine analysis, renal biopsy findings if available, etc.) should play a more significant role when the RF model predicts a positive outcome owing to the high false-positive rate and low positive predictive value. This scenario is related to the inability to capture reversibility in certain features (such as postoperative improvement in renal perfusion and renal function), uncertainty around donor quality, and perioperative course.We also evaluated our RF model with an external cohort (an external validation), 353 patients who underwent SHKT between January 10, 2019, and September 30, 2020. Our predictive model classified 93% of SHKT patient into the positive class and 7% of SHKT patients into the negative class, which suggests that the clinical re-evaluation of 7% of patients for SHKT eligibility is necessary.Strengths of this study include large sample size and utilization of the RF method with a multidimensional dataset. Nevertheless, the limitations are as follows: (i) potential bias inherent to the observational study design owing to unmeasured patient characteristics; (ii) vulnerability to significant changes in heart donor allocation policies affecting center practice and patient characteristics; and (iii) not capturing uncertainties potentially introducing prolonged AKI resulting from donor characteristics and postoperative complications.In conclusion, the proposed web-based decision tool powered by an RF-based machine learning method is an objective and cross-validated tool for patient-level identification of CRO risk among at-risk HT candidates.DisclosureThe author, JLG, served as a consultant in the advisory board of Pfizer, Inc., Alnylam, Eidos Therapeutics, and Sarepta. All the other authors declared no competing interests. IntroductionEnd-stage renal disease after heart transplant (HT) is associated with higher mortality and cost of care.1Cantarovich M. Hirsh A. Alam A. et al.The clinical impact of an early decline in kidney function in patients following heart transplantation.Am J Transplant. 2009; 9: 348-354https://doi.org/10.1111/j.1600-6143.2008.02490.xCrossref PubMed Scopus (27) Google Scholar,2Hornberger J. Best J. Geppert J. McClellan M. Risks and costs of end-stage renal disease after heart transplantation.Transplantation. 1998; 66: 1763-1770https://doi.org/10.1097/00007890-199812270-00034Crossref PubMed Scopus (43) Google Scholar Early and late renal failure after HT are caused by pretransplant comorbid factors (age, chronic kidney disease [CKD], diabetes mellitus, hypertension, and smoking), perioperative recurrent acute kidney injury (AKI), and use of nephrotoxic immunosuppressive agents (calcineurin inhibitors).3Lachance K. White M. Carrier M. et al.Long-term evolution, secular trends, and risk factors of renal dysfunction following cardiac transplantation.Transpl Int. 2014; 27: 824-837https://doi.org/10.1111/tri.12340Crossref PubMed Scopus (15) Google Scholar,4Habib P.J. Patel P.C. Hodge D. et al.Pre-orthotopic heart transplant estimated glomerular filtration rate predicts post-transplant mortality and renal outcomes: an analysis of the UNOS database.J Heart Lung Transplant. 2016; 35: 1471-1479https://doi.org/10.1016/j.healun.2016.05.028Abstract Full Text Full Text PDF PubMed Scopus (30) Google ScholarThe rate of simultaneous heart-kidney transplantation (SHKT) due to comorbid kidney disease has increased in the past decade.5Ariyamuthu V.K. Amin A.A. Drazner M.H. et al.Induction regimen and survival in simultaneous heart-kidney transplant recipients.J Heart Lung Transplant. 2018; 37: 587-595https://doi.org/10.1016/j.healun.2017.11.012Abstract Full Text Full Text PDF PubMed Scopus (7) Google Scholar The Organ Procurement and Transplant Network/the United Network for Organ Sharing, which oversees organ transplantation in the United States, has not set a national policy to guide SHKT. Thus, the decision for SHKT is currently left to individual transplant centers’ discretion. A consensus conference in 2019 on heart-kidney transplantation set the stage for developing guidelines for medical eligibility criteria for SHKT for candidates with established CKD (glomerular filtration rate [GFR] <60 ml/min per 1.73 m2) and persistent AKI.6Kobashigawa J. Dadhania D.M. Farr M. et al.Consensus conference on heart-kidney transplantation.Am J Transplant. 2021; 21: 2459-2467https://doi.org/10.1111/ajt.16512Crossref PubMed Scopus (12) Google Scholar Their Heart/Kidney Workgroup advised that, based on 2 independent GFR measurements at least 2 weeks apart, patients with established GFR <30 ml/min per 1.73 m2 and selected candidates with GFR of 30 to 44 ml/min per 1.73 m2 (having strong evidence of CKD including small kidney sizes and proteinuria >0.5 g/d) should be considered for SHKT. Remaining patients with CKD with GFR of 45–59 ml/min per 1.73 m2 may not be suitable for SHKT. Nevertheless, applying these criteria to HT alone recipients between 2000 and 2019, approximately 33% of them with an estimated GFR of 30–59 ml/min per 1.73 m2 pretransplant (Supplementary Table S1), not considered as eligible for SHKT, may still be at risk of developing end-stage renal disease. Therefore, a personalized computer-aided model to predict the possibility of advanced kidney failure in early post-transplant period is needed to identify at-risk candidates.In this study, we developed a machine learning (random forest [RF])–based algorithm to predict composite renal outcomes (CRO defined as dependence on chronic dialysis, GFR <20 ml/min per 1.73 m2, or having received a kidney transplant) among adult HT recipients at risk (GFR <60 ml/min per 1.73 m2) at post-transplant 1 year. We also built a web-based decision tool based on the RF model (Figure 1). The details regarding the study cohort selection (Supplementary Figure S1) and the methods are provided in the Supplementary Materials.
Introduction: COVID-19 is likely to continue affecting populations across the world and with novel virulent strains regularly emerging, it is critical to determine which patients are at risk for its severe manifestations. Earlier scoring tools for prognostication had limitations including high risk for bias and lack of generalizability. (1) The development of newer COVID-19 scoring tools should take into account novel biomarkers of disease like immature platelet fraction% (IPF%). IPF% has been shown to be a predictor of clinical outcomes in COVID-19. (2, 3) The aim of this study is fi rst, to identify prognostic markers for disease severity in COVID-19. Second, we aim to incorporate these prognostic markers into a COVID-19 scoring tool, to help clinicians identify patients at risk for disease progression, morbidity, and mortality. Study Population: This study was a retrospective cohort analysis of 1,795 patients above the age of 18 hospitalized due to
Melanoma is a deadly skin disease. Availability of digital skin lesion datasets ease the exploration of ample classification studies. Both theoretical and heuristics improvements are achieved thanks to these new datasets. Being one of many high‐level feature‐driven classification methods, support vector machines (SVMs) are widely used in the literature as melanoma classifiers. Almost all of these studies are using a limited set of predefined kernels. In this study, we propose a newly developed Clifford kernel for the classification of dermoscopic skin lesions. We develop Clifford‐based linear, polynomial, and exponential kernels in the Clifford algebra (CA) C ℓ 5, 0 0‐, 2‐, and 4‐vector subspaces. CAs are noncommutative but associative and distributive over addition. We showed that the newly developed Clifford kernels are embedded into SVM classifiers to successfully identify malignant skin lesions in a binary classification settings. Clifford kernel results are compared with mostly used gaussian and polynomial kernels with real‐valued SVM classifiers. Accuracy of all classifiers are assessed with cross‐validation using imbalanced and balanced datasets of 112, 162, and 192 lesions. SVM kernels in comparison are parameterized to scan wide range of possibilities. We show that Clifford‐based polynomial kernels outperforms in all, balanced and imbalanced, datasets having average accuracy of 83%. The consistence of high accuracies obtained with Clifford polynomial kernel shows that skin lesion features are logically designed and Clifford‐based SVM is able to model class separations in the feature space.
COVID-19 pandemic has brought immense attention to SARS-CoV-2 and related microbiology studies. To defeat this deadly virus, its RNA is being studied by many researchers around the globe. This study primarily aims to compile a large RNA dataset to analyze RNA secondary structure of SARS-CoV-2 efficiently. We propose improvements on database creation and maintenance, and structure analysis tools. As a continuation of our previous works, we automate the creation of RNA secondary structures database in a new format by converting data collected from publicly available online resources. We present new secondary structure analysis algorithms that improve performance of existing tools. Results of GPU-based implementation are also presented for RNA search operations. We also introduce tools with new objectives, which answer fundamental RNA secondary structure queries. Our tools on the current database have been tested with SARS-CoV-2 related RNA secondary structures. A novel RNA secondary structure search-based multiple RNA comparison is introduced and tested too. Structural-only and structure-with-nucleotide search results particularly related to SARS-CoV-2 are presented in details. As a successful case study, the framework presented here offers some unique capabilities and is shown as a useful exploratory tool for future RNA analysis studies.
This study reports results of a pilot study, in which pigmented skin lesions are automatically classified into four classes: benign, dysplastic nevus with mild atypia, dysplastic nevus with severe atypia, and melanoma. The pilot study enrolled subjects from dermatology clinic at Baylor University Medical Center at Dallas from June 2016 to August 2017. 30 high-quality dermoscopic images were randomly selected from an image bank of 96 to obtain a statistically balanced dataset. Melanoma samples were histologically verified. A dermoscopy-based automated image analyzer with quaternary classification of pigmented skin lesions was proposed. The image analyzer automatically extracts five lesion features, most used in clinical practise, applying an active contour, and pairwise classification employing six Support Vector Machines. The pairwise accuracy of classifications are reported between 92% and 94% and used to determine the corresponding confidence intervals. Through the pairwise classification results maximum hits and acyclic tree decisions were utilized to reach the final classification of a lesion. Using leave-one-out validation, accuracy of the quaternary dermoscopy-based image analyzer were determined as 90% using the histopathologic diagnoses as the ground truth. This novel, dermoscopy-based image classifier accurately classifies pigmented skin lesions small data-sets into benign, two types of dysplastic nevi, and malignant lesions. To the best of our knowledge, there is no other automated skin lesion classification framework, in the literature, which distinguishes between different nevus lesion.
 Sinan Kockara合作论文数Department of Computer Science, University of Central Arkansas;University of Arkansas at Little Rock;Biomedical Image Processing and High Performance Computing Lab13
 Nikolay Metodiev Sirakov合作论文数Dept . of Mathematics and Statistics11
 Bat Taha合作论文数National Heart, Lung, and BloodInstitute, National Institutes of Health8
 Matthew A. Franchek合作论文数8
 Xiaowei Xu合作论文数Department of Information Science, University of Arkansas at Little Rock6
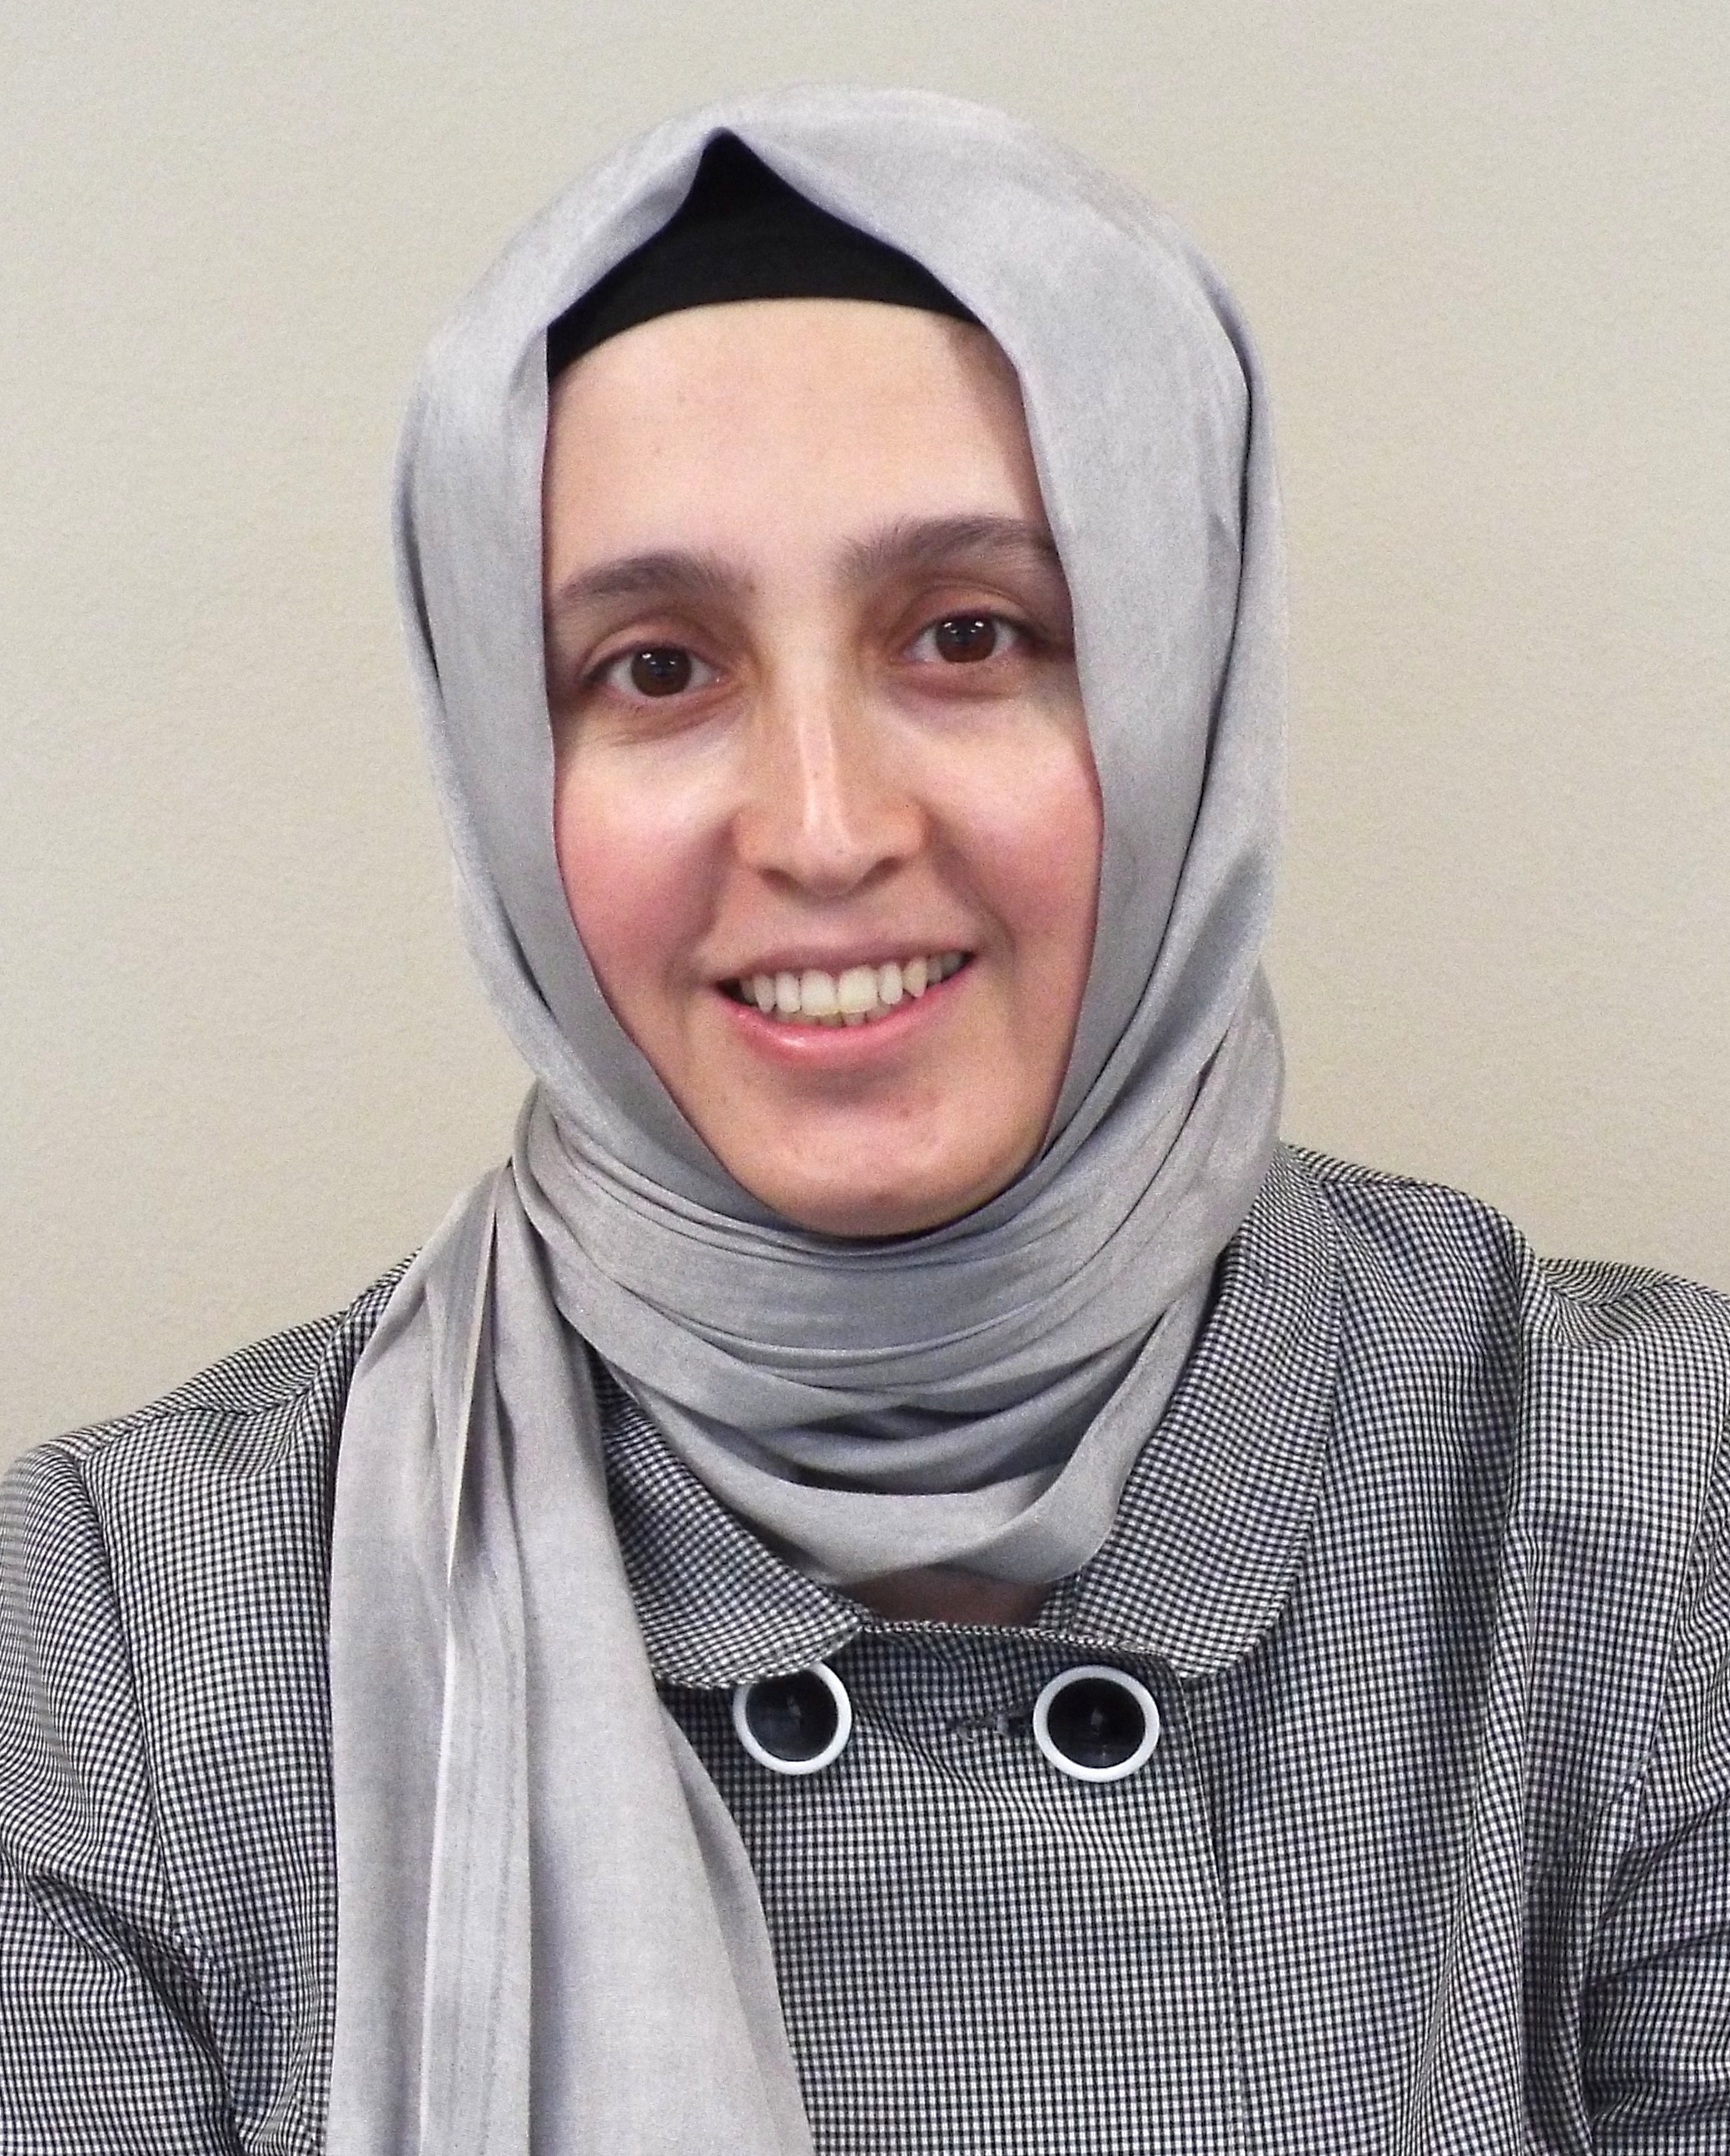 Nurcan Yuruk合作论文数University of Arkansas at Little Rock6
 Quan Wen (文泉)合作论文数School of Computer Science and Engineering, University of Electronic Science and Technology of China5
 Juan Chen (陈娟)合作论文数School of Conmputer Science and Engineering, University of Electronic Science and Technology of China5
 Mehmet Ayvaci合作论文数University of Wisconsin - Madison5
 Bekir Tanriover合作论文数5
 Carmelo Gurnari合作论文数Dept Biomed & Prevent, Univ Roma Tor Vergata4Taoufik Wassar合作论文数4
 Bryon Adinoff合作论文数Department of Psychiatry, School of Medicine, University of Colorado Anschutz Medical Campus4
 Jaroslaw P. Maciejewski合作论文数Department of Medicine, School of Medicine, Case Western Reserve University;Department of Pathology, School of Medicine, Case Western Reserve University;Department of Translational Hematology and Oncology Research, Taussig Cancer Institute, Cleveland Clinic;Case Comprehensive Cancer Center, Case Western Reserve University4
 Tansel Halic合作论文数Adv. Comput. Res. Lab., Rensselaer Polytech. Inst., Troy, NY, USA4
 José Angel Gutiérrez合作论文数Center for Mexican American Studies, University of Texas at Arlington4Ibrahim F. Ibrahim合作论文数3Vincent Yip合作论文数3Chenglong Zhuo合作论文数3Savas Ozdemir合作论文数3Sindhu Kumar合作论文数Department of Radiology, UF College of Medicine-Jacksonville3Dheeraj Reddy Gopireddy合作论文数3
 Prince Mohan合作论文数Div Nephrol, Med Univ South Carolina3
 Venkatesh K Ariyamuthu合作论文数Division of Nephrology, Banner University Medical Center3
 Mauricio Hernandez合作论文数3
 Mark Drazner合作论文数Department of Internal Medicine, UT Southwestern Medical Center3Araj Faris合作论文数3
 Kazim Z. Gumus合作论文数Department of Radiology, College of Medicine, University of Florida3Weina Chen合作论文数3
 Malcolm P MacConmara合作论文数Brigham and Women’s Hospital, Harvard Medical School3
 Unal Sakoglu合作论文数Department of Computer Science and Information Systems, Texas A&M University - Commerce3
 Pradeep P A Mammen合作论文数Department of Internal Medicine, University of Texas Southwestern Medical Center3
 K.C. Balaji合作论文数Worcester3
 Umit Topaloglu合作论文数University of Arkansas for Medical Sciences3
 Gal Shafirstein合作论文数University of Arkansas for Medical Sciences3
 Bernard Chen合作论文数Department of Computer Science and Engineering, University of Central Arkansas3
 Alpesh N. Amin合作论文数Department of Medicine, School of Medicine, University of California, Irvine;Institute for Precision Health, University of California, Irvine;Henry Samueli School of Engineering, University of California, Irvine;School of Nursing, University of California, Irvine;UCI Health3
 Kemal Aydin合作论文数Dept. of Applied Science, University of Arkansas at Little Rock3Ahsen Atis合作论文数2Bilal Ashraf合作论文数2
 Ye-Lin Ou (欧业林)合作论文数Department of Mathematics, Texas A & M University-Commerce2Ganesh Raman合作论文数2
 Chun-Yang Fan合作论文数2Ira Harmon合作论文数2Mustafa Atar合作论文数2
 Ala Eddine Omrani合作论文数University of Houston2Corey D Kershaw合作论文数2Hussein Awada合作论文数Translational Hematology and Oncology Research, Cleveland Clinic2
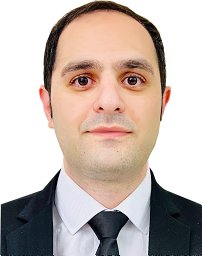 Mojtaba Afshar合作论文数University of Texas at Dallas2




