In 2014, a satellite-based map of regional anomalies of atmospheric methane (CH4) column retrievals singled out the fossil fuel rich San Juan Basin (SJB) as the biggest CH4 regional anomaly (“hot spot”) in the United States. Over a 3-week period in April 2015, we conducted ground and airborne atmospheric measurements to investigate daily wind regimes and CH4 emissions in this region of SW Colorado and NW New Mexico. The SJB, similar to other topographical basins with local sources, experienced elevated surface air pollution under low wind and surface temperature inversion at night and early morning. Survey drives in the basin identified multiple CH4 and ethane (C2H6) sources with distinct C2H6-to-CH4 emission plume ratios for coal bed methane (CBM), natural gas, oil, and coal production operations. Air samples influenced by gas seepage from the Fruitland coal formation outcrop in La Plata County, CO, had enhanced CH4, with no C2-5 light alkane enhancements. In situ fast-response data from seven basin survey flights, all with westerly winds, were used to map and attribute the detected C2H6 and CH4 emission plumes. C2H6-to-CH4 plume enhancement correlation slopes increased from north to south, reflecting the composition of the natural gas and/or CBM extracted in different parts of the basin. Nearly 75% of the total detected CH4 and 85% of the total detected C2H6 hot spot were located in New Mexico. Emissions from CBM and natural gas operations contributed 66% to 75% of the CH4 hot spot. Emissions from oil operations in New Mexico contributed 5% to 6% of the CH4 hot spot and 8% to 14% of the C2H6 hot spot. Seepage from the Fruitland coal outcrop in Colorado contributed at most 8% of the total detected CH4, while gas venting from the San Juan underground coal mine contributed <2%.
An intensive coordinated airborne and ground-based measurement study was conducted in the Fayetteville Shale in northwestern Arkansas during September and October 2015 to compare and explain potential discrepancies between top-down and bottom-up estimates of regional natural gas (NG) methane (CH4) emissions. In situ mobile downwind measurements are used to document the ethane to methane enhancement ratios (ERs) in emission plumes from NG operations in the region. Enhancement ratios are low (<2% for 87% of NG sources sampled) in this dry gas-producing region and normally distributed around 1.3% in the western half of the study area. A few sampled landfills emitted CH4 but no ethane (C2H6). Sampling drives around large chicken farms, prevalent in the region, did not detect significant downwind CH4 enhancements. In situ airborne measurements of C2H6 and CH4 from area-scale surveys over and downwind of the region documented the resulting ERs from a mix of CH4 sources. Based on these measurements, we show that on average during the measurement windows 85–95% of total CH4 emissions in the western half of the Fayetteville Shale originated from NG sources, which agrees well with bottom-up estimates from the same field study. Lower mixing ratios measured over the eastern half of the region did not support the ER analysis due to the low signal-to-noise on C2H6 measurements.
This study analyzes seasonal and spatial patterns of column carbon dioxide (CO2) over North America, calculated from aircraft and tall tower measurements from the NOAA Global Greenhouse Gas Reference Network from 2004 to 2014. Consistent with expectations, gradients between the eight regions studied are larger below 2 km than above 5 km. The 11-year mean CO2 dry mole fraction (XCO2) in the column below ∼ 330 hPa ( ∼ 8 km above sea level) from NOAA's CO2 data assimilation model, CarbonTracker (CT2015), demonstrates good agreement with those calculated from calibrated measurements on aircraft and towers. Total column XCO2 was attained by combining modeled CO2 above 330 hPa from CT2015 with the measurements. We find large spatial gradients of total column XCO2 from June to August, with north and northeast regions having ∼ 3 ppm stronger summer drawdown (peak-to-valley amplitude in seasonal cycle) than the south and southwest regions. The long-term averaged spatial gradients of total column XCO2 across North America show a smooth pattern that mainly reflects the large-scale circulation. We have conducted a CarbonTracker experiment to investigate the impact of Eurasian long-range transport. The result suggests that the large summertime Eurasian boreal flux contributes about half of the north–south column XCO2 gradient across North America. Our results confirm that continental-scale total column XCO2 gradients simulated by CarbonTracker are realistic and can be used to evaluate the credibility of some spatial patterns from satellite retrievals, such as the long-term average of growing-season spatial patterns from satellite retrievals reported for Europe which show a larger spatial difference ( ∼ 6 ppm) and scattered hot spots.
Seasonal spatial and temporal gradients for the CO2 mole fraction over North America are examined by creating a climatology from data collected 2004-2013 by the NOAA/ESRL Global Greenhouse Gas Reference Network Aircraft Program relative to trends observed for CO2 at the Mauna Loa Observatory. The data analyzed are from measurements of air samples collected in specially fabricated flask packages at frequencies of days to months at 22 sites over continental North America and shipped back to Boulder, Colorado, for analysis. These measurements are calibrated relative to the CO2 World Meteorological Organization mole fraction scale. The climatologies of CO2 are compared to climatologies of CO, CH4, SF6, N2O (which are also measured from this sampling program), and winds to understand the dominant transport and chemical and biological processes driving changes in the spatial and temporal mole fractions of CO2 as air passes over continental North America. The measurements show that air masses coming off the Pacific on the west coast of North America are relatively homogeneous with altitude. As air masses flow eastward, the lower section from the surface to 4000 m above sea level (masl) becomes distinctly different from the 4000-8000 masl section of the column. This is due in part to the extent of the planetary boundary layer, which is directly impacted by continental sources and sinks, and to the vertical gradient in west-to-east wind speeds. The slowdown and southerly shift in winds at most sites during summer months amplify the summertime drawdown relative to what might be expected from local fluxes. This influence counteracts the dilution of summer time CO2 drawdown (known as the rectifier effect) as well as changes the surface influence footprint for each site. An early start to the summertime drawdown, a pronounced seasonal cycle in the column mean (500 to 8000 masl), and small vertical gradients in CO2, CO, CH4, SF6, and N2O at high-latitude western sites such as Poker Flat, Alaska, suggest recent influence of transport from southern latitudes and not local processes. This transport pathway provides a significant contribution to the large seasonal cycle observed in the high latitudes at all altitudes sampled. A sampling analysis of the NOAA/ESRL CarbonTracker model suggests that the average sampling resolution of 22days is sufficient to get a robust estimate of mean seasonal cycle of CO2 during this 10year period but insufficient to detect interannual variability in emissions over North America.
Four-year ground-level measurements of the two primary greenhouse gases (carbon dioxide (CO2) and methane (CH4)) were conducted at Dongsha Island (DSI), situated in the northern South China Sea (SCS), from March 2010 to February 2014. Their mean mixing ratios are calculated to be 396.3 ± 5.4 ppm and 1863.6 ± 50.5 ppb, with an annual growth rate of +2.19 ± 0.5 ppm yr–1 and +4.70 ± 4.4 ppb yr–1 for CO2 and CH4, respectively, over the study period. Our results suggest that the Asian continental outflow driven by the winter northeast monsoon could have brought air pollutants into the northern SCS, as denoted by significantly elevated levels of 6.5 ppm for CO2 and 59.6 ppb for CH4, which are greater than the marine boundary layer references at Cape Kumukahi (KUM) in the tropical northern Pacific in January. By contrast, the summertime CH4 at DSI is shown to be lower than that at KUM by 19.7 ppb, whereas CO2 is shown to have no differences (<0.42 ppm in July) during the same period. Positive biases of the Greenhouse Gases Observing Satellite (GOSAT) L4B data against the surface measurements are estimated to be 2.4 ± 3.4 ppm for CO2 and 43.2 ± 36.8 ppb for CH4. The satellite products retrieved from the GOSAT showed the effects of anthropogenic emissions and vegetative sinks on land on a vertical profiling basis. The prevailing southeasterly winds originating from as far south as the equator or Southern Hemisphere pass through the lower troposphere in the northern SCS, forming a tunnel of relatively clean air masses as indicated by the low CH4 mixing ratios observed on the DSI in summer.
Emissions of methane (CH4) from oil and natural gas (O&G) operations in the most densely drilled area of the Denver‐Julesburg Basin in Weld County located in northeastern Colorado are estimated for 2 days in May 2012 using aircraft‐based CH4 observations and planetary boundary layer height and ground‐based wind profile measurements. Total top‐down CH4 emission estimates are 25.8 ± 8.4 and 26.2 ± 10.7 t CH4/h for the 29 and 31 May flights, respectively. Using inventory data, we estimate the total emissions of CH4 from non‐O&G gas‐related sources at 7.1 ± 1.7 and 6.3 ± 1.0 t CH4/h for these 2 days. The difference in emissions is attributed to O&G sources in the study region, and their total emission is on average 19.3 ± 6.9 t/h, close to 3 times higher than an hourly emission estimate based on Environmental Protection Agency's Greenhouse Gas Reporting Program data for 2012. We derive top‐down emissions estimates for propane, n‐butane, i‐pentane, n‐pentane, and benzene from our total top‐down CH4 emission estimate and the relative hydrocarbon abundances in aircraft‐based discrete air samples. Emissions for these five nonmethane hydrocarbons alone total 25.4 ± 8.2 t/h. Assuming that these emissions are solely originating from O&G‐related activities in the study region, our results show that the state inventory for total volatile organic compounds emitted by O&G activities is at least a factor of 2 too low for May 2012. Our top‐down emission estimate of benzene emissions from O&G operations is 173 ± 64 kg/h, or 7 times larger than in the state inventory.
Atmospheric CO were monitored at the Lulin Atmospheric Background Station (LABS) with an elevation of 2862 m AMSL from April 2006 to April 2011 by the in-situ non-dispersive infrared (NDIR) spectrometer and weekly flask sample collections via collaboration with NOAA/ESRL/GMD. In general very coherent results were observed between the two datasets, despite a slight difference between the two. A distinct seasonal pattern of CO was noticed at the LABS with a springtime maximum and a summertime minimum, which was predominately shaped by the long-range transport of biomass burning air masses from Southeast Asia and oceanic influences from the Pacific, respectively. Diurnal cycles were also observed at the LABS, with a maximum in late afternoon and a minimum in early morning. The daytime CO maximum was most likely caused by the up-slope transport of lower elevation air. After filtering out the possibly polluted data points from the entire dataset with a mathematic procedure, the mean background CO level at the LABS was assessed as 1293 +/- 46.6 ppb, compared to 149.0 +/- 72.2 ppb prior to the filtering.The cluster analysis of the backward trajectories revealed six possible source regions, which shows that air masses originating from the Westerly Wind Zone were dominated in spring and winter resulting in higher CO concentrations. As a contrast, the oceanic influences from the Pacific were found mostly in summer, contributing a lower seasonal CO concentration throughout a year. (C) 2014 Elsevier Ltd. All rights reserved.
Methane (CH4) emissions from natural gas production are not well quantified and have the potential to offset the climate benefits of natural gas over other fossil fuels. We use atmospheric measurements in a mass balance approach to estimate CH4 emissions of 5515 x 10(3) kg h(-1) from a natural gas and oil production field in Uintah County, Utah, on 1 day: 3 February 2012. This emission rate corresponds to 6.2%-11.7% (1 sigma) of average hourly natural gas production in Uintah County in the month of February. This study demonstrates the mass balance technique as a valuable tool for estimating emissions from oil and gas production regions and illustrates the need for further atmospheric measurements to determine the representativeness of our single-day estimate and to better assess inventories of CH4 emissions.
We present the first reconstruction of the Northern Hemisphere (NH) high latitude atmospheric carbon monoxide (CO) mole fraction from Greenland firn air. Firn air samples were collected at three deep ice core sites in Greenland (NGRIP in 2001, Summit in 2006 and NEEM in 2008). CO records from the three sites agree well with each other as well as with recent atmospheric measurements, indicating that CO is well preserved in the firn at these sites. CO atmospheric history was reconstructed back to the year 1950 from the measurements using a combination of two forward models of gas transport in firn and an inverse model. The reconstructed history suggests that Arctic CO in 1950 was 140–150 nmol mol−1, which is higher than today's values. CO mole fractions rose by 10–15 nmol mol−1 from 1950 to the 1970s and peaked in the 1970s or early 1980s, followed by a ≈ 30 nmol mol−1 decline to today's levels. We compare the CO history with the atmospheric histories of methane, light hydrocarbons, molecular hydrogen, CO stable isotopes and hydroxyl radicals (OH), as well as with published CO emission inventories and results of a historical run from a chemistry-transport model. We find that the reconstructed Greenland CO history cannot be reconciled with available emission inventories unless unrealistically large changes in OH are assumed. We argue that the available CO emission inventories strongly underestimate historical NH emissions, and fail to capture the emission decline starting in the late 1970s, which was most likely due to reduced emissions from road transportation in North America and Europe.
The multispecies analysis of daily air samples collected at the NOAA Boulder Atmospheric Observatory (BAO) in Weld County in northeastern Colorado since 2007 shows highly correlated alkane enhancements caused by a regionally distributed mix of sources in the Denver‐Julesburg Basin. To further characterize the emissions of methane and non‐methane hydrocarbons (propane, n‐butane, i‐pentane, n‐pentane and benzene) around BAO, a pilot study involving automobile‐based surveys was carried out during the summer of 2008. A mix of venting emissions (leaks) of raw natural gas and flashing emissions from condensate storage tanks can explain the alkane ratios we observe in air masses impacted by oil and gas operations in northeastern Colorado. Using the WRAP Phase III inventory of total volatile organic compound (VOC) emissions from oil and gas exploration, production and processing, together with flashing and venting emission speciation profiles provided by State agencies or the oil and gas industry, we derive a range of bottom‐up speciated emissions for Weld County in 2008. We use the observed ambient molar ratios and flashing and venting emissions data to calculate top‐down scenarios for the amount of natural gas leaked to the atmosphere and the associated methane and non‐methane emissions. Our analysis suggests that the emissions of the species we measured are most likely underestimated in current inventories and that the uncertainties attached to these estimates can be as high as a factor of two.
Sixteen mixtures of methane (CH4) in dry air were prepared using a gravimetric technique to define a CH4 standard gas scale covering the nominal range 300–2600 nmol mol−1. It is designed to be suitable for measurements of methane in air ranging from those extracted from glacial ice to contemporary background atmospheric conditions. All standards were prepared in passivated, 5.9 L high‐pressure aluminum cylinders. Methane dry air mole fractions were determined by gas chromatography with flame ionization detection, where the repeatability of the measurement is typically better than 0.1% (≤1.5 nmol mol−1) for ambient CH4 levels. Once a correction was made for 5 nmol mol−1 CH4 in the diluent air, the scale was used to verify the linearity of our analytical system over the nominal range 300–2600 nmol mol−1. The gravimetrically prepared standards were analyzed against CH4 in air standards that define the Climate Monitoring and Diagnostics Laboratory (CMDL) CMDL83 CH4 in air scale, showing that CH4 mole fractions in the new scale are a factor of (1.0124 ± 0.0007) greater than those expressed in the CMDL83 scale. All CMDL measurements of atmospheric CH4 have been adjusted to this new scale, which has also been accepted as the World Meteorological Organization (WMO) CH4 standard scale; all laboratories participating in the WMO Global Atmosphere Watch program should report atmospheric CH4 measurements to the world data center on this scale.
For the past decade NOAA/CMDL has measured tropospheric carbon monoxide from a global network of sampling sites. The resulting data set provides an internally consistent picture of CO in the lower troposphere that is used to study its distribution, trends and budget. All measurements were referenced to the so‐called CMDL Reference Scale (WMO 88), which was based on two sets of primary standards produced at CMDL during the late 1980s and early 1990s. A long‐term downward trend in tropospheric CO during the 1990s, overlaid with shorter periods of increase and decrease, was indicated from the air measurements. Primary standards prepared in 1999 and 2000 suggested that the scale had drifted upward over time, and that mixing ratios determined in field samples were underestimated. We have applied a time dependent correction to our CO measurements based upon four sets of primary standards. In this paper, we describe the revision of the CO scale and our atmospheric measurements. A reanalysis of tropospheric trends through 2001 was based on the revised global data set. The results support previous reports of a decline in tropospheric CO. This decrease is now found largely confined to the Northern Hemisphere, where dramatic reductions in fossil fuel emissions have reportedly occurred. In contrast, no significant trend is determined in the Southern Hemisphere between 1991 and 2001. Globally averaged CO exhibits large interannual variability, primarily reflecting year to year changes in emissions from biomass burning. Dramatic enhancements of tropospheric CO in 1997 and 1998 resulted from exceptionally widespread wildfires which provided a strong pulse of CO to the atmosphere. In years of extensive boreal biomass burning, fire emissions can perturb CO levels over regional and global scales, disturbing oxidation/reduction chemistry in the troposphere.
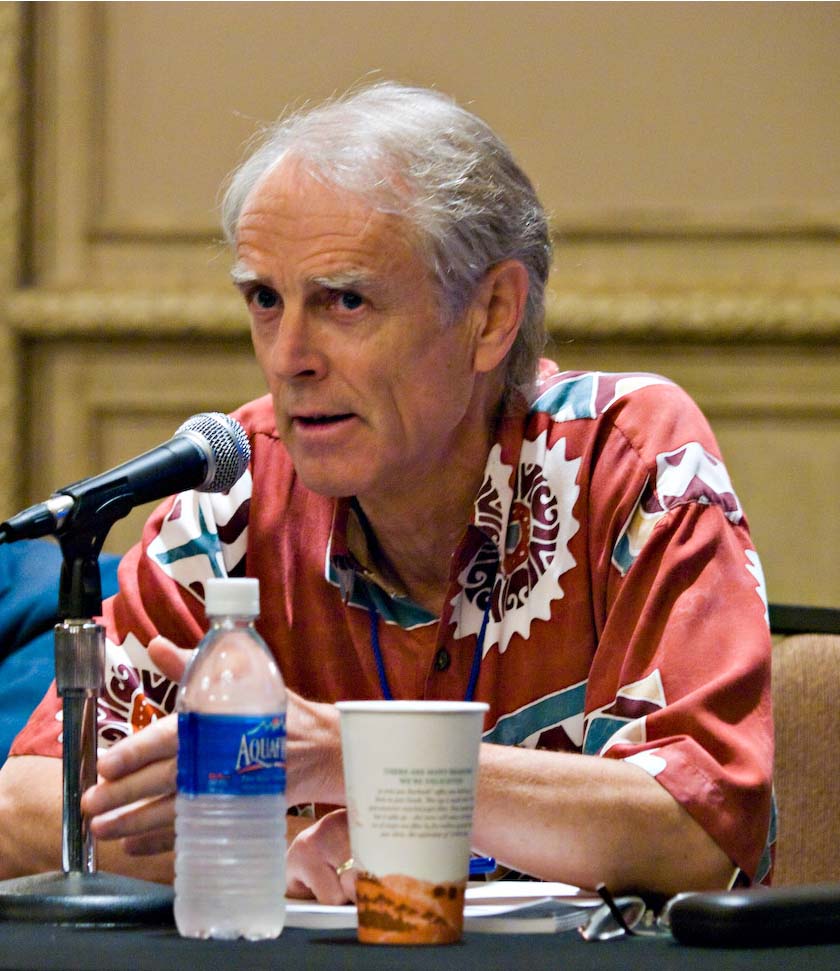 Pieter Tans合作论文数Global Monitoring Laboratory, National Oceanic & Atmospheric Administration;Institute of Arctic and Alpine Research, University of Colorado Boulder14
 Kenneth A. Masarie合作论文数12Paul C. Novelli合作论文数11E. J. Dlugokencky合作论文数11
 John Kalivas合作论文数Department of Chemistry, Idaho State University10Paul Steele合作论文数CSIRO9Edward J. Dlugokencky合作论文数9
 Colm Sweeney合作论文数Global Monitoring Laboratory, National Oceanic and Atmospheric Administration, Earth System Research Laboratories8KA Masarie合作论文数7jonathan kofler合作论文数7Sonja Wolter合作论文数7
 Gabrielle Petron合作论文数7
 Bradley D. Hall合作论文数Earth Syst Res Lab, NOAA6
 Russell Schnell合作论文数Cooperative Institute for Research in Environmental Sciences, University of Colorado6
 Stephen Montzka合作论文数Global Monitoring Laboratory, National Oceanic and Atmospheric Administration5
 Arlyn Andrews合作论文数Global Monitoring Laboratory, National Oceanic and Atmospheric Administration5Jm Brenchley合作论文数4Molly Crotwell合作论文数4
 Jim Elkins合作论文数Cooperative Institute for Research in Environmental Sciences, University of Colorado Boulder4Andrew M. Crotwell合作论文数4Reinaldo G. Nieves合作论文数4Anna Karion合作论文数Division of Engineering and Applied Sciences, California Institute of Technology4Duane Kitzis合作论文数3Tim Newberger合作论文数3
 Jim White合作论文数College of Arts and Sciences, University of North Carolina at Chapel Hill3
 John B. Miller合作论文数Cooperative Institute for Research in Environmental Science, University of Colorado Boulder;Global Monitoring Laboratory, National Oceanic & Atmospheric Administration3
 Michael Trainer合作论文数Chemical Sciences Laboratory, National Oceanic and Atmospheric Administration;Earth System Research Laboratory, National Oceanic and Atmospheric Administration3Stephen A. Conley合作论文数3Kirk Thoning合作论文数3Gregory J. Frost合作论文数3Mark Battle合作论文数3L. Bruhwiler合作论文数3R. C. Myers合作论文数3Ben R. Miller合作论文数2Dan Wolfe合作论文数2S. Houweling合作论文数2Eryka Thorley合作论文数2Eric Moglia合作论文数2Ingrid Mielke-Maday合作论文数2s hammer合作论文数2douglas guenther合作论文数2LP Steele合作论文数2Michael Rhodes合作论文数2
 Xin Lan合作论文数Cooperative Institute for Research in Environmental Sciences, University of Colorado Boulder2
 Andrew Jacobson合作论文数Department of Earth and Planetary Sciences, Weinberg College of Arts and Sciences, Northwestern University2
 Schwietzke Stefan合作论文数Department of Engineering and Public Policy, Carnegie Mellon University2John Mak合作论文数State University of New York at Stony Brook, Stony Brook University2
 Jeffrey Severinghaus合作论文数Geosciences Research Division, Scripps Institution of Oceanography, University of California, San Diego2Z. Wang合作论文数2




