Abstract Background: As novel targeted therapies including drug, radio-, and immune-conjugates, advance toward broad clinical implementation, there is an urgent need for scalable, minimally invasive diagnostics capable of resolving gene expression programs to guide patient selection and therapeutic monitoring. We applied a comprehensive epigenomics liquid biopsy and machine learning platform to infer tumor gene expression, delineate lineage plasticity, and reveal therapeutically relevant molecular programs and resistance mechanisms from only 1 mL of plasma. Methods: 1 mL of plasma from a pan-cancer cohort of patients (95 prostate adenocarcinoma (PRAD), 19 neuroendocrine prostate cancer (NEPC), 45 non-small cell lung cancer, 58 small cell lung cancer, 130 breast cancer, 21 gastroesophageal cancer, and 5 ovarian cancer) was profiled using Precede Biosciences liquid biopsy platform. All samples were assessed for the expression of therapeutically relevant targets. In prostate cancer, samples were further evaluated for the extent of neuroendocrine (NE) transformation, a key mechanism of lineage plasticity and therapeutic resistance. Results: Plasma-derived NE scores distinguished prostate adenocarcinoma (PRAD, n = 97) from neuroendocrine prostate cancer (NEPC, n = 15) along a continuous axis. Intermediate scores suggested partial or heterogeneous NE differentiation, with concurrent expression of PRAD- and NE-associated markers. Within these prostate cancer samples, predicted gene expression profiles clearly differentiated PRAD (high AR, KLK2, KLK3, FOLH1/PSMA) from NEPC (high CHGA, DLL3, SEZ6). DLL3 expression was further assessed across a multi-cancer cohort, and plasma-based predictions demonstrated a dynamic range consistent with published observations in tissue using both IHC and RNA-seq. For a subset of patients with matched FFPE tissue, immunohistochemistry for key drug targets is being performed to assess concordance with plasma-based expression predictions. Conclusion: Plasma-based epigenomic profiling resolved tumor gene expression programs of key therapeutic targets such as DLL3 and delineated a continuum of neuroendocrine differentiation, uncovering molecular states associated with therapeutic response and resistance. Collectively, these findings underscore the potential of a minimally invasive, comprehensive epigenomics platform to deliver real-time, gene expression-level insights into tumor evolution and target expression, thereby guiding therapeutic decision-making. Citation Format: Nicole Kramer, Jonathan Beagan, Aparna Gorthi, Praful K. Ravi, Rashad Nawfal, Anthony D'Ippolito, Sylvan C. Baca, Travis A. Clark, Khoi Nguyen, Daniel Karl, Kristian Cibulskis, Karl Semaan, Marc Eid, Jacob E. Berchuck, Corrie A. Painter, Matthew L. Eaton, J. Carl Barrett. Plasma-based comprehensive epigenomic profiling enables multiplexed prediction of target gene expression and detection of resistance mechanisms [abstract]. In: Proceedings of the American Association for Cancer Research Annual Meeting 2026; Part 1 (Regular Abstracts); 2026 Apr 17-22; San Diego, CA. Philadelphia (PA): AACR; Cancer Res 2026;86(7 Suppl):Abstract nr 7821.
8642 Background: Genomic overexpression or amplification of MET is an established bypass resistance mechanism in EGFR-mutated (EGFRm) NSCLC, observed in up to 34% of patients whose tumors progress on osimertinib. Savolitinib, an oral, highly selective MET TKI, demonstrates clinical activity in tumors classified as MET-high by tissue-based IHC or FISH. However, tissue at progression is often inaccessible or insufficient for repeated assessment, constraining dynamic characterization of MET pathway dependence and emerging resistance mechanisms. To overcome these limitations, we applied an epigenomic liquid biopsy platform to a subset of patients enrolled in the Phase II SAVANNAH trial that combined osimertinib and savolitinib after progression on 1L osimertinib (NCT03778229), where we evaluated the feasibility of capturing MET activity and additional resistance markers from plasma. Methods: Baseline samples from 40 patients enrolled in the SAVANNAH trial with progression on 1L osimertinib, were profiled using an epigenomic assay (Precede Biosciences, Boston MA) on 1mL of plasma. Tissue-based analysis from the SAVANNAH cohort scored 15/40 tumors as MET-high/+ (FISH 10+, IHC 3+ ≥90%+) and 25 samples as MET-low/- (FISH < 10, IHC 3+ < 90%). A plasma-based MET classifier integrating comprehensive epigenomic features was applied to these samples and its performance evaluated against tissue MET status. ctDNA fraction was independently estimated. Pathway analyses on genome-wide differential epigenomic activity were performed to define MET-associated biology and infer tumor gene expression from plasma. Results: The plasma-based MET classifier demonstrated strong agreement with tissue-based MET status (AUC 0.97; balanced accuracy 88%), with an estimated limit of quantification (LoQ) of ~0.8% ctDNA. MET+ samples displayed enrichment of epigenomic signatures consistent with MET-dependence, including MYC targets, metabolic signatures, and invasive and developmental programs. In contrast, MET-negative (MET-) samples were enriched for IFN-driven immune pathways and apoptotic priming. Gene expression models across multiple ADC targets applied to patient plasma samples from SAVANNAH also identified elevated EGFR and HER2 expression in select cases. Conclusions: Comprehensive epigenomic profiling of plasma demonstrated high concordance with tissue-based approaches, identifying MET pathway activation and additional putative resistance-associated targets, from 1 mL of plasma in EGFRm NSCLC patients. This provides an accessible and scalable blood-based test to increase identification of patients post-EGFR inhibitor treatment, who may benefit from MET-targeted therapy, resistance monitoring, and informing future combination or sequential MET-directed strategies.
Cell type annotation in single-cell RNA sequencing (scRNA-seq) experiments is the fundamental step of assigning cell types to individual cells or clusters of cells based on their gene expression profiles. This process is crucial for developing biological insights from scRNA-seq experiments. We present a service that automates cell type annotation for 10x Genomics single-cell gene expression samples, enabling researchers to rapidly and accurately categorize cells within a sample. This service operates on the basis of reverse search: it compares each cell's gene expression profile against the Chan Zuckerberg CELL by GENE (CZ CELLxGENE) Census, a comprehensive repository of published scRNA-seq datasets enriched with community-annotated cell types, and yields cell type annotations through summarizing the labels associated with similar cells. The annotation algorithm employed in this service avoids reliance on predefined marker genes or tissue-specific references, providing both fine-grained and coarse annotations. These initial annotations can be further refined by investigators to suit their specific research needs.
5074 Background: The PSMA-directed radioligand therapy, 177Lu-PSMA-617, is the most recent FDA approved therapy in mCRPC. Despite prolonging progression-free survival (PFS) and overall survival (OS) at a population level, response to therapy is heterogeneous and resistance remains poorly understood. Benchmarking molecular correlates of clinical outcomes following 177Lu-PSMA-617 could provide critical insights into predicting response and resistance to therapy. We applied a multimodal epigenomic liquid biopsy platform to plasma samples from mCRPC patients treated with 177Lu-PSMA-617 to characterize molecular features associated with treatment response. Methods: Baseline plasma samples were collected from patients with mCRPC at the time of PSMA PET imaging and initiation of 177Lu-PSMA-617 therapy. Epigenomic profiling of genome-wide signals from promoters, enhancers, and DNA methylation was performed on 1 mL of plasma (N=85, ctDNA ≥ 0.5%). Plasma epigenomic signals were analyzed to evaluate pathway activity, their association with treatment response using Cox proportional hazards model and neuroendocrine transformation. Response to 177Lu-PSMA-617 was determined by investigator-assessed clinical-radiographic (CR)-PFS. Results: We observed a significant association between predicted PSMA PET SUV mean from plasma epigenomic signals (using a previously derived model) and response to 177Lu-PSMA-617 (hazard ratio [HR] = 0.27, P<0.05). Further, unbiased analysis of plasma epigenomic signal across the genome identified FOLH1 (the gene encoding PSMA) as being significantly associated with CR-PFS (P<0.05). Low circulating tumor fraction was also independently associated with favorable CR-PFS (HR = 0.42, P<0.05). Pathway analysis identified activation of estrogen signalling and cellular plasticity to be associated with shorter CR-PFS, and immune signalling gene signatures to be associated with longer CR-PFS (all FDR<0.1). A subset of patients (n=4) exhibited increased plasma epigenomic signal at neuroendocrine genes, such as CHGA , DLL3 and SEZ6 . While too small to draw statistical conclusions, elevated neuroendocrine gene activity in plasma was associated with numerically shorter OS. Conclusions: Epigenomic profiling of plasma cfDNA enabled minimally-invasive characterization of molecular correlates of response and resistance, identifying genes and pathways associated with favorable and poor outcomes to 177Lu-PSMA-617 in mCRPC. By providing real-time insights into tumor biology and therapeutic efficacy, this platform supports precision medicine approaches for optimizing outcomes in PSMA-targeted therapies.
PDF file, 12065K, Supplementary Table S4. Complete listing of all somatic mutations seen in all tumors. This table provides details on every non-synonymous mutation or short insertion/deletion observed in this cohort, with data on genomic coordinates, protein change, protein region affected, and read counts for each event. Many additional annotations are provided (e.g. cDNA change, RefSeq number)
XLSX file 3709K, Alterations with Significantly Enriched CCF from Pretreatment to Resistant
Supplementary Figure Legends 1-4, Methods from Temporal Dissection of Tumorigenesis in Primary Cancers
XLSX file 261K, Supplementary Table S3. Mutations seen in patients with tumors at one time point. For patients with whole exome sequencing data on either pre-treatment (for early resistance cases) or after relapse (for acquired resistance cases), this table summarizes the complete set of non-synonymous mutations and short insertion/deletions called. Alterations in this table met the additional criteria of at least 30X coverage in the tumor and an allelic fraction of at least 0.05. Each column is a patient, each row is a gene, and each non-blank entry denotes the protein change that results from the mutation seen
XLSX file 3569K, Change in Cancer Cell Fraction for all SNVs and Indels in All Samples
XLSX file 90K, Alterations in Each Patient in Genes that Scored in Functional Screens
 Gad A. Getz合作论文数Harvard Medical School;Department of Pathology, Massachusetts General Hospital;Broad Institute of Harvard and MIT113
 Stacey Gabriel合作论文数The Broad Institute of Harvard and Massachusetts Institute of Technology90
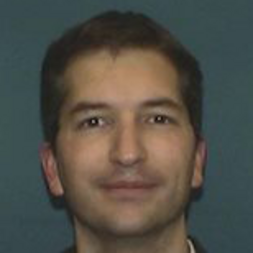 Scott L. Carter合作论文数Division of Medical Sciences, Harvard Medical School;Joint Center for Cancer Precision Medicine, Dana-Farber Cancer Institute;Harvard T.H. Chan School of Public Health68
 Carrie Sougnez合作论文数61
 Michael S. Lawrence合作论文数Harvard Medical School;Lawrence Laboratory, Mass General Cancer Center, Massachusetts General Hospital52
 Matthew L. Meyerson合作论文数Harvard Medical School;Center for Cancer Genomics, Dana-Farber Cancer Institute52
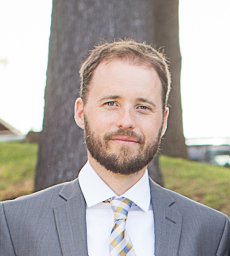 Aaron McKenna合作论文数The Broad Institute of MIT and Harvard, Cambridge, MA 02142;The Broad Institute of MIT and Harvard, Cambridge, MA 02142;50
 Levi Garraway合作论文数Roche;Genentech48
 Andrey Sivachenko合作论文数Broad Inst MIT & Harvard46
 Eric S. Lander合作论文数Department of Biology, Massachusetts Institute of Technology;Harvard Medical School;Broad Institute, Massachusetts Institute of Technology44
 Rosenberg Mara合作论文数32Daniel Auclair合作论文数29
 Eliezer Van Allen合作论文数Division of Population Sciences, Dana-Farber Cancer Institute;Harvard Medical School28
 Todd R. Golub合作论文数Broad Institute;Dana-Farber Cancer Institute;Harvard Medical School27Eran Hodis合作论文数Department of Computer Science and Applied Mathematics, Weizmann Institute of Science26
 Amaro N Taylor Weiner合作论文数Absci25Alex H Ramos合作论文数Dept Med Oncol, Dana Farber Canc Inst25Robert C. Onofrio合作论文数24Gordon Saksena合作论文数24Kryukov Gregory V合作论文数Broad Inst Harvard & MIT24
 Nikhil Wagle合作论文数Dana-Farber / Harvard Cancer;Harvard Medical School;Genentech24Douglas Voet合作论文数24
 Chip Stewart合作论文数Broad Inst24Petar Stojanov合作论文数Carnegie Mellon University22Wendy Winckler合作论文数22
 Sheila A Fisher合作论文数19Daniel Treacy合作论文数18Lauren Ambrogio合作论文数18Deborah N Farlow合作论文数17
 Trevor Pugh合作论文数Department of Medical Biophysics, Temerty Faculty of Medicine, University of Toronto;Princess Margaret Cancer Centre, University Health Network;Translational Genomics Laboratory, Ontario Institute for Cancer Research16Goetz Eva M合作论文数16Cory M. Johannessen合作论文数Genetics Division, Department of Medicine, Brigham and Women's Hospital and Harvard Medical School, 458c NRB, 77 Louis Pasteur Avenue, Boston, Massachusetts 0211516Erica Shefler合作论文数15Eric Banks合作论文数Broad Inst MIT & Harvard, Data Sci Platform, Cambridge, MA 02142 USA14
 Catherine J. Wu合作论文数Department of Medical Oncology, Dana-Farber Cancer Institute;Division of Stem Cell Transplantation and Cellular Therapies, Dana-Farber Cancer Institute;Harvard Medical School14
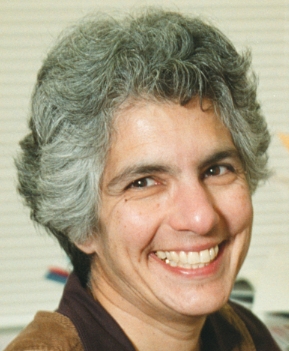 Donna Neuberg合作论文数Department of Biostatistics, Harvard T.H. Chan School of Public Health;Dana-Farber Cancer Institute14
 Mark Daly合作论文数Analytic and Translational Genetics Unit, Mass General Research Institute, Massachusetts General Hospital;Center for Genomic Medicine, Massachusetts General Hospital;Division of Medical Sciences, Harvard Medical School;Broad Institute13Elizabeth Nickerson合作论文数13
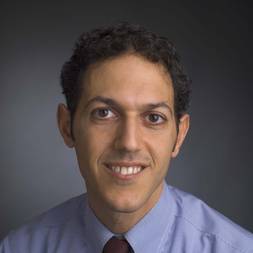 Rameen Beroukhim合作论文数Division of Medical Sciences, Harvard Medical School;Dana-Farber Cancer Institute12
 Nicolas Stransky合作论文数UMR 144 CNRS, Institut Curie12Danielle Perrin合作论文数11Dennis C Friedrich合作论文数11Melissa Parkin合作论文数11
 Jennifer Wargo合作论文数Department of Surgical Oncology, Division of Surgery, The University of Texas MD Anderson Cancer Center;Department of Genomic Medicine, Division of Cancer Medicine, The University of Texas MD Anderson Cancer Center11Lee Lichtenstein合作论文数11Chelsea Place合作论文数10
 William C. Hahn合作论文数Department of Medical Oncology, Dana-Farber Cancer Institute;Harvard Medical School;Broad Institute, MIT10
 Lynda Chin合作论文数Apricity Health10
 Dirk Schadendorf合作论文数Clinic for Dermatology, University Hospital Essen;University of Duisburg-Essen;West German Tumor Center10




